
By Julia Karo and Monica Appiano
We are back to covering class projects from Habitat Mapping this week. Julia Karo and Monica Appiano ("The Ladies") will walk us through their study of marshland growth in Elkhorn Slough. Recently designated a Wetland of International Importance, the Slough supports the most extensive salt marshes in California south of San Francisco Bay. Currently, a $6.5 million, 61-acre tidal wetland project is restoring drowning marshes to elevations that will better withstand changes in sea level in the coming century.
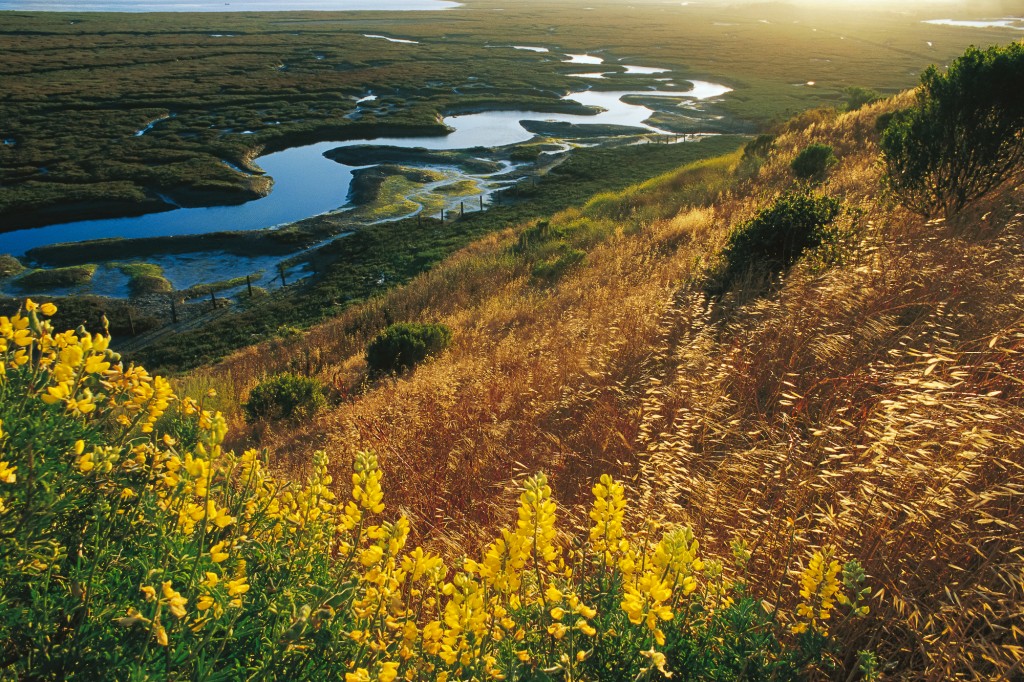
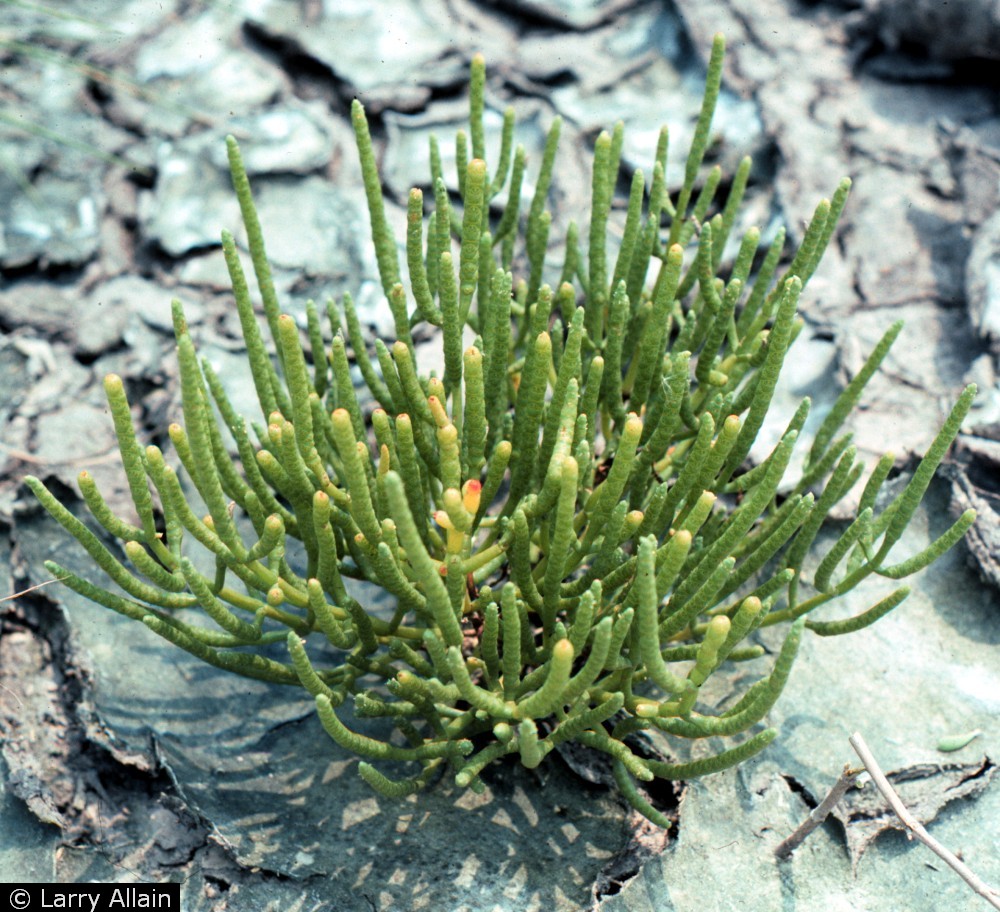
For our class project for the Habitat Mapping class taught at MLML during Fall 2018 we have explored marsh growth and distribution patterns around the Moss Landing Wildlife Area. The area is a bird watcher's paradise and is located between Highway 1 and Seal Bend, an area where the mostly straight channel of Elkhorn Slough curves. The marsh at the Wildlife Area is mostly composed of pickleweed (Salicornia virginica) and is expanding, unlike most of Elkhorn Slough’s marshes. We were motivated to explore why this might be happening.
Some questions to consider when approaching this type of project include:
- What causes pickleweed to die off?
- What causes pickleweed to expand?
- What is the geological history of the land in this area?
- What is the composition of soil that promotes expansion/decay of pickleweed?
- What type of geostatistics and analytical tools can be used to understand habitat classification of the slough?
When deciding on what type of spatial classification to perform in ArcGIS --a software that allows users to create and analyze maps-- there are a few things we had to consider. While programs like ArcGIS are very powerful tools, there are many different variables and characteristics that must be decided by the scientist before the data can be analyzed. Examples of these different factors include:
- Imagery resolution and number of raster bands
- Supervised vs. Unsupervised classification
- Differences in training sets (optimum pixel counts in training set polygons)
- Using same/different signature files for different rasters when analyzing trends over time
- Editing and cleaning classification output
After imagery was re-sampled to the finest resolution imagery data we could find (60 cm), semi-automatic classification was performed on all NAIP imagery data using the maximum- likelihood tool. The maximum likelihood tool is best to use when conducting a form of supervised classification. It allows you to create and verify habitat classes and bases the classification on individual pixels. Optimal pixel counts of training sample polygons were determined to be between 40 - 400 pixels. Individual signature files were used for each yearly raster because of differences in vegetation signatures depending on the year. The main channel of the slough was then masked to reduce ambiguity between main channel water signatures and marsh signatures.
Elkhorn Slough National Estuarine Research Reserve (ESNERR) has been investigating these questions for many years and has discovered that pickleweed grows within a very narrow range of elevation between mean height water and the highest tides. They also found that pickleweed is most productive in a 50cm elevational span around Mean Height High Water.
We aren’t quite sure what changes the ideal elevation range. It could be deeply rooted movements of the soil (e.g. a fault, subsidence, earthquakes, etc). Healthy marshes are constantly sinking, but they also trap sediments in suspension, which allows them to grow. The tidal water assists with the sediments being able to keep up with the subsidence, maintaining equilibrium. Too much sediment in the habitat, however, leads to a declination in soil content and the marsh dying off, resulting into a mudflat. With this information, we propose that particle size is finer in areas of dense pickleweed. This supports our hypothesis that when wind driven sand is increasing, sand elevation also increases, making pickleweed growth successful. The overall goal of our project was assisting restoration efforts that can support other marsh restoration projects within California.
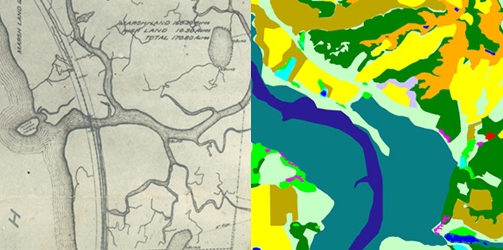
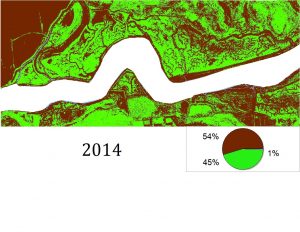
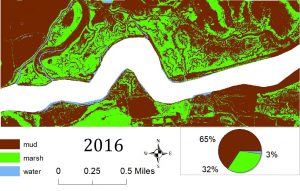
So far, we have created habitat classification maps based on NAIP aerial imagery and quantified habitat types using pixel count bar graphs for this area for the years 2012, 2014 and 2016. You can see examples of our maps below. Notice how the proportions of each color (habitat type) change over time.
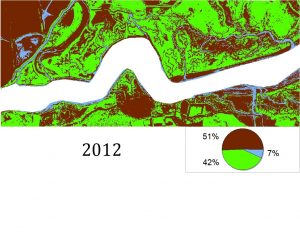
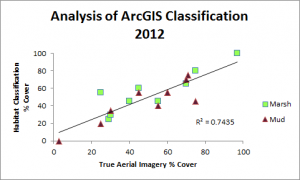
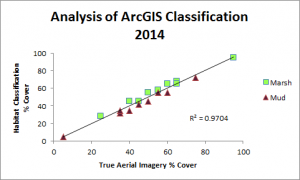
Classification was performed and statistics were generated using an accuracy assessment. Validation of image classification was analyzed using reference data where randomly distributed polygons were “ground-truthed” and compared to classification results. Essentially, we were testing how good our program was at telling the difference between marsh and mud habitat in our actual study after training it on reference data. You can see the results below:

To collect this data, we went out in the field to this specific section of Elkhorn Slough early in December and took six sediment core samples of areas classified as dense pickleweed (marsh) , mud/algae, and areas of bare soil. We were limited in access to our desirable locations for field collection --read: it was too muddy to get to all the places we wanted or they were on private property-- so all our samples were taken within a few meters of one another. We then compared these samples with a particle size analyzer within the Geological Oceanography lab to see if there are any trends in grain size and sediment.
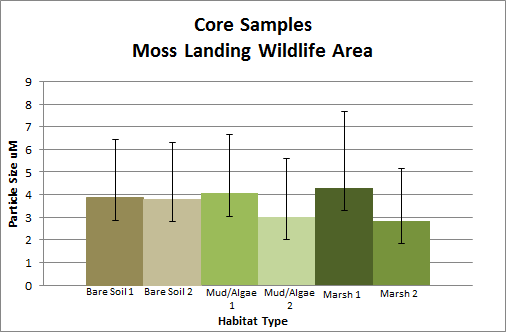
We found that marsh habitat generally had coarser sediments (silt size), while bare soil & mud-algae habitats had finer (clay size) sediments, suggesting that wind input is not necessarily the mechanism promoting marsh growth. Although our hypothesis was not confirmed by this work, these composition results provide overall insight on the health of the marsh and what configuration is necessary for sustainable marsh growth.
In order to further this investigation, we would suggest taking core samples from more locations around Moss Landing Wildlife Area and analyze both the top and bottom of each core sample in the same way.