
By Victoria Dickey and Amelia Labbe
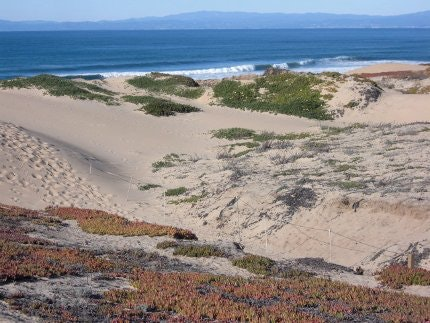
Dunes are essential to protecting our low-lying coastal communities and agriculture fields here in Monterey from storms, waves, and erosion. The beautiful slopes of these beach dunes are naturally controlled by the wind and the waves. The dunes that we see here are blanketed by green and red ice plant. Ice plant (Carpobrotus edulis) was introduced in the early 1900s to stabilize the naturally shifting dunes, but scientists now think that it may actually increase erosion.
It grows very quickly, forming a thick, heavy mat which can collapse the soil or sand underneath. The ice plant then drops to the new elevation, instead of anchoring the sand. In addition, ice plant is an invasive species that hampers ecosystem diversity and the growth of native plants. The latter have longer root systems that serve to stabilize the dunes. They don’t drop in elevation but allow dune sand to shift around them and build back up when less intense winds drift sand their way. It may be important to eradicate ice plant and introduce native plants for the preservation of not only our dunes but also our communities as climate change increases the frequency of storm events.
For a class project in the Habitat Mapping class taught at MLML in Fall 2018, we worked with the Central Coast Wetlands Group (CCWG), which is an affiliate research group at Moss Landing Marine Lab (MLML) focused on the study, preservation and restoration of Central Coast Wetlands in the Monterey Bay Area. They are currently working on a restoration project along the Salinas River State Beach, removing ice plant and planting native plants. The area being restored is from just south of the Protrero Road entrance down to the mouth of the Salinas River. Thanks to the CCWG and the MLML’s Geological Oceanography Lab, we acquired drone surveys from 2015 and 2016 and a plethora of additional information of the same area we surveyed for our project.
Questions for our study and how we planned to go about it
In our study, we focused on some basic questions: how much and where sand erosion is occurring on dunes around Moss Landing, and, how does dune morphology respond to restoration over time, specifically from October 2015 to December 2018?
Our experience: what we did for our fieldwork and post processing; hardships
To answer these questions, we surveyed 2 sections of beach in front of MLML. Our first survey took place on the beach in front of the aquaculture center adjacent to the head of the Monterey Submarine Canyon and continued south to the Protrero Beach entrance. This was our ‘practice run’ - gathering data for MLML, but not in connection to the CCWG restoration project. Our second survey was from the Protrero Beach entrance, continuing south for approximately 300m. This section is part of the CCWG project and where we are able to show possible changes in dune morphology with restoration over time.
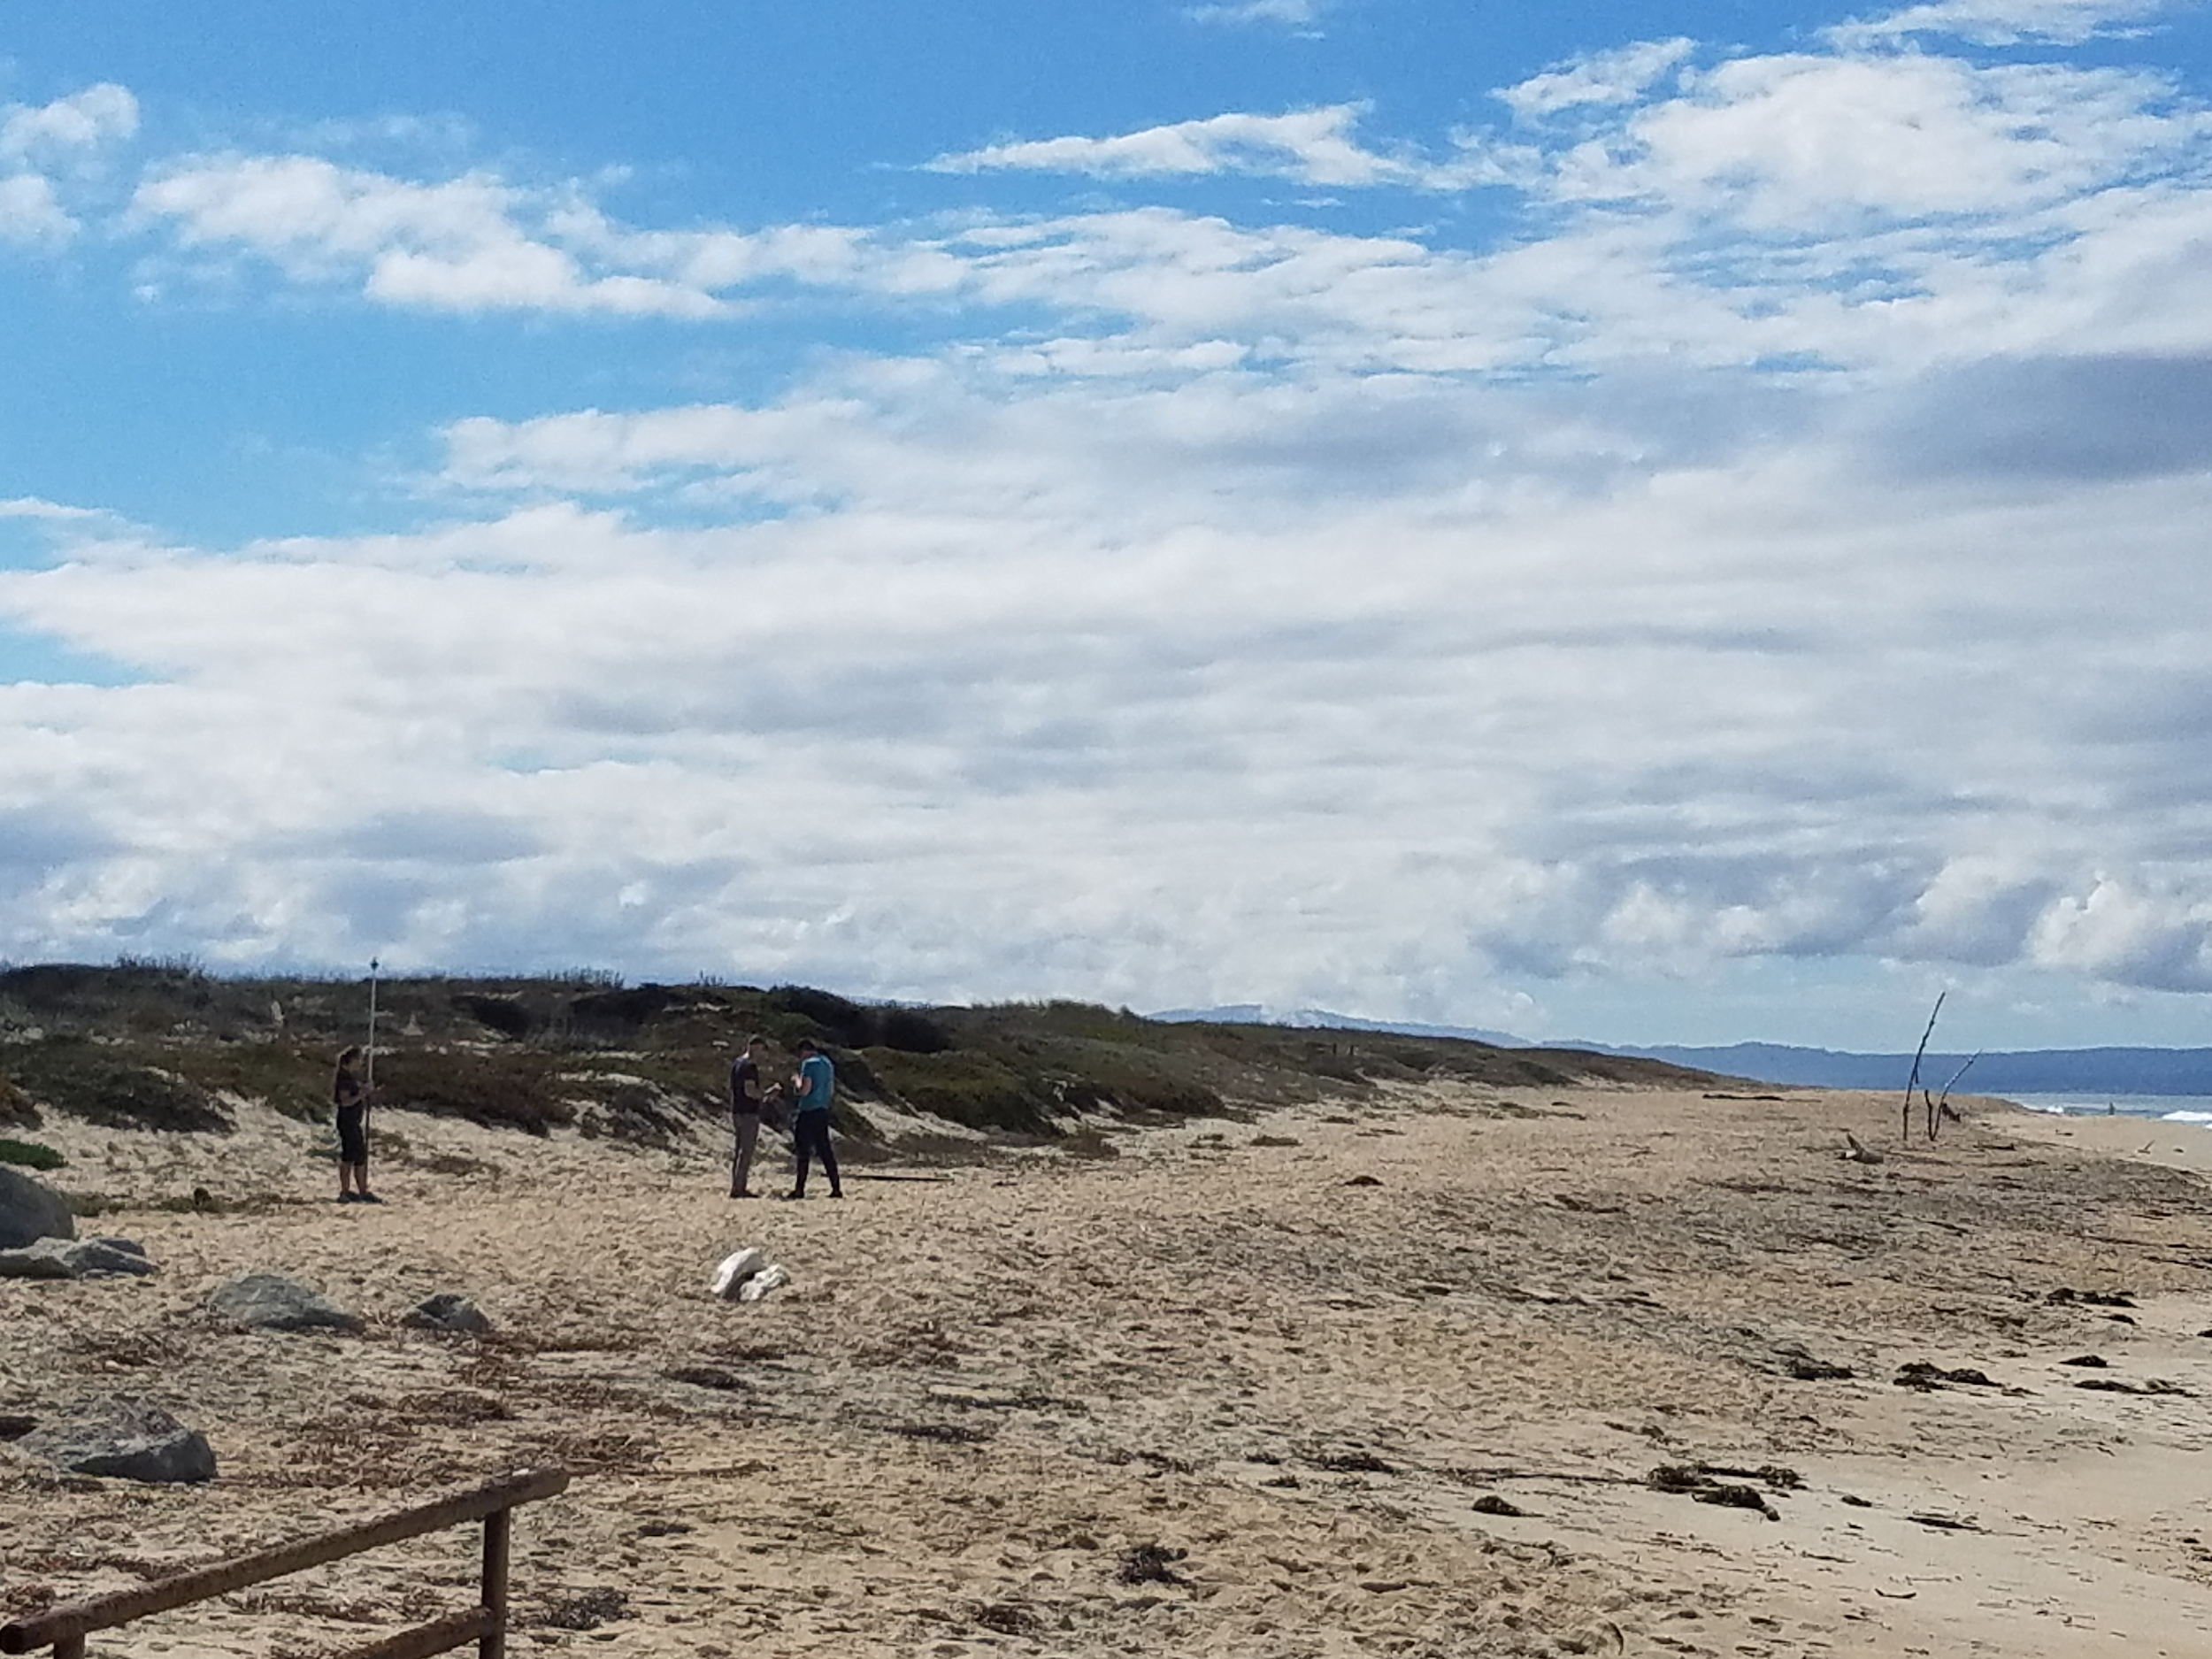
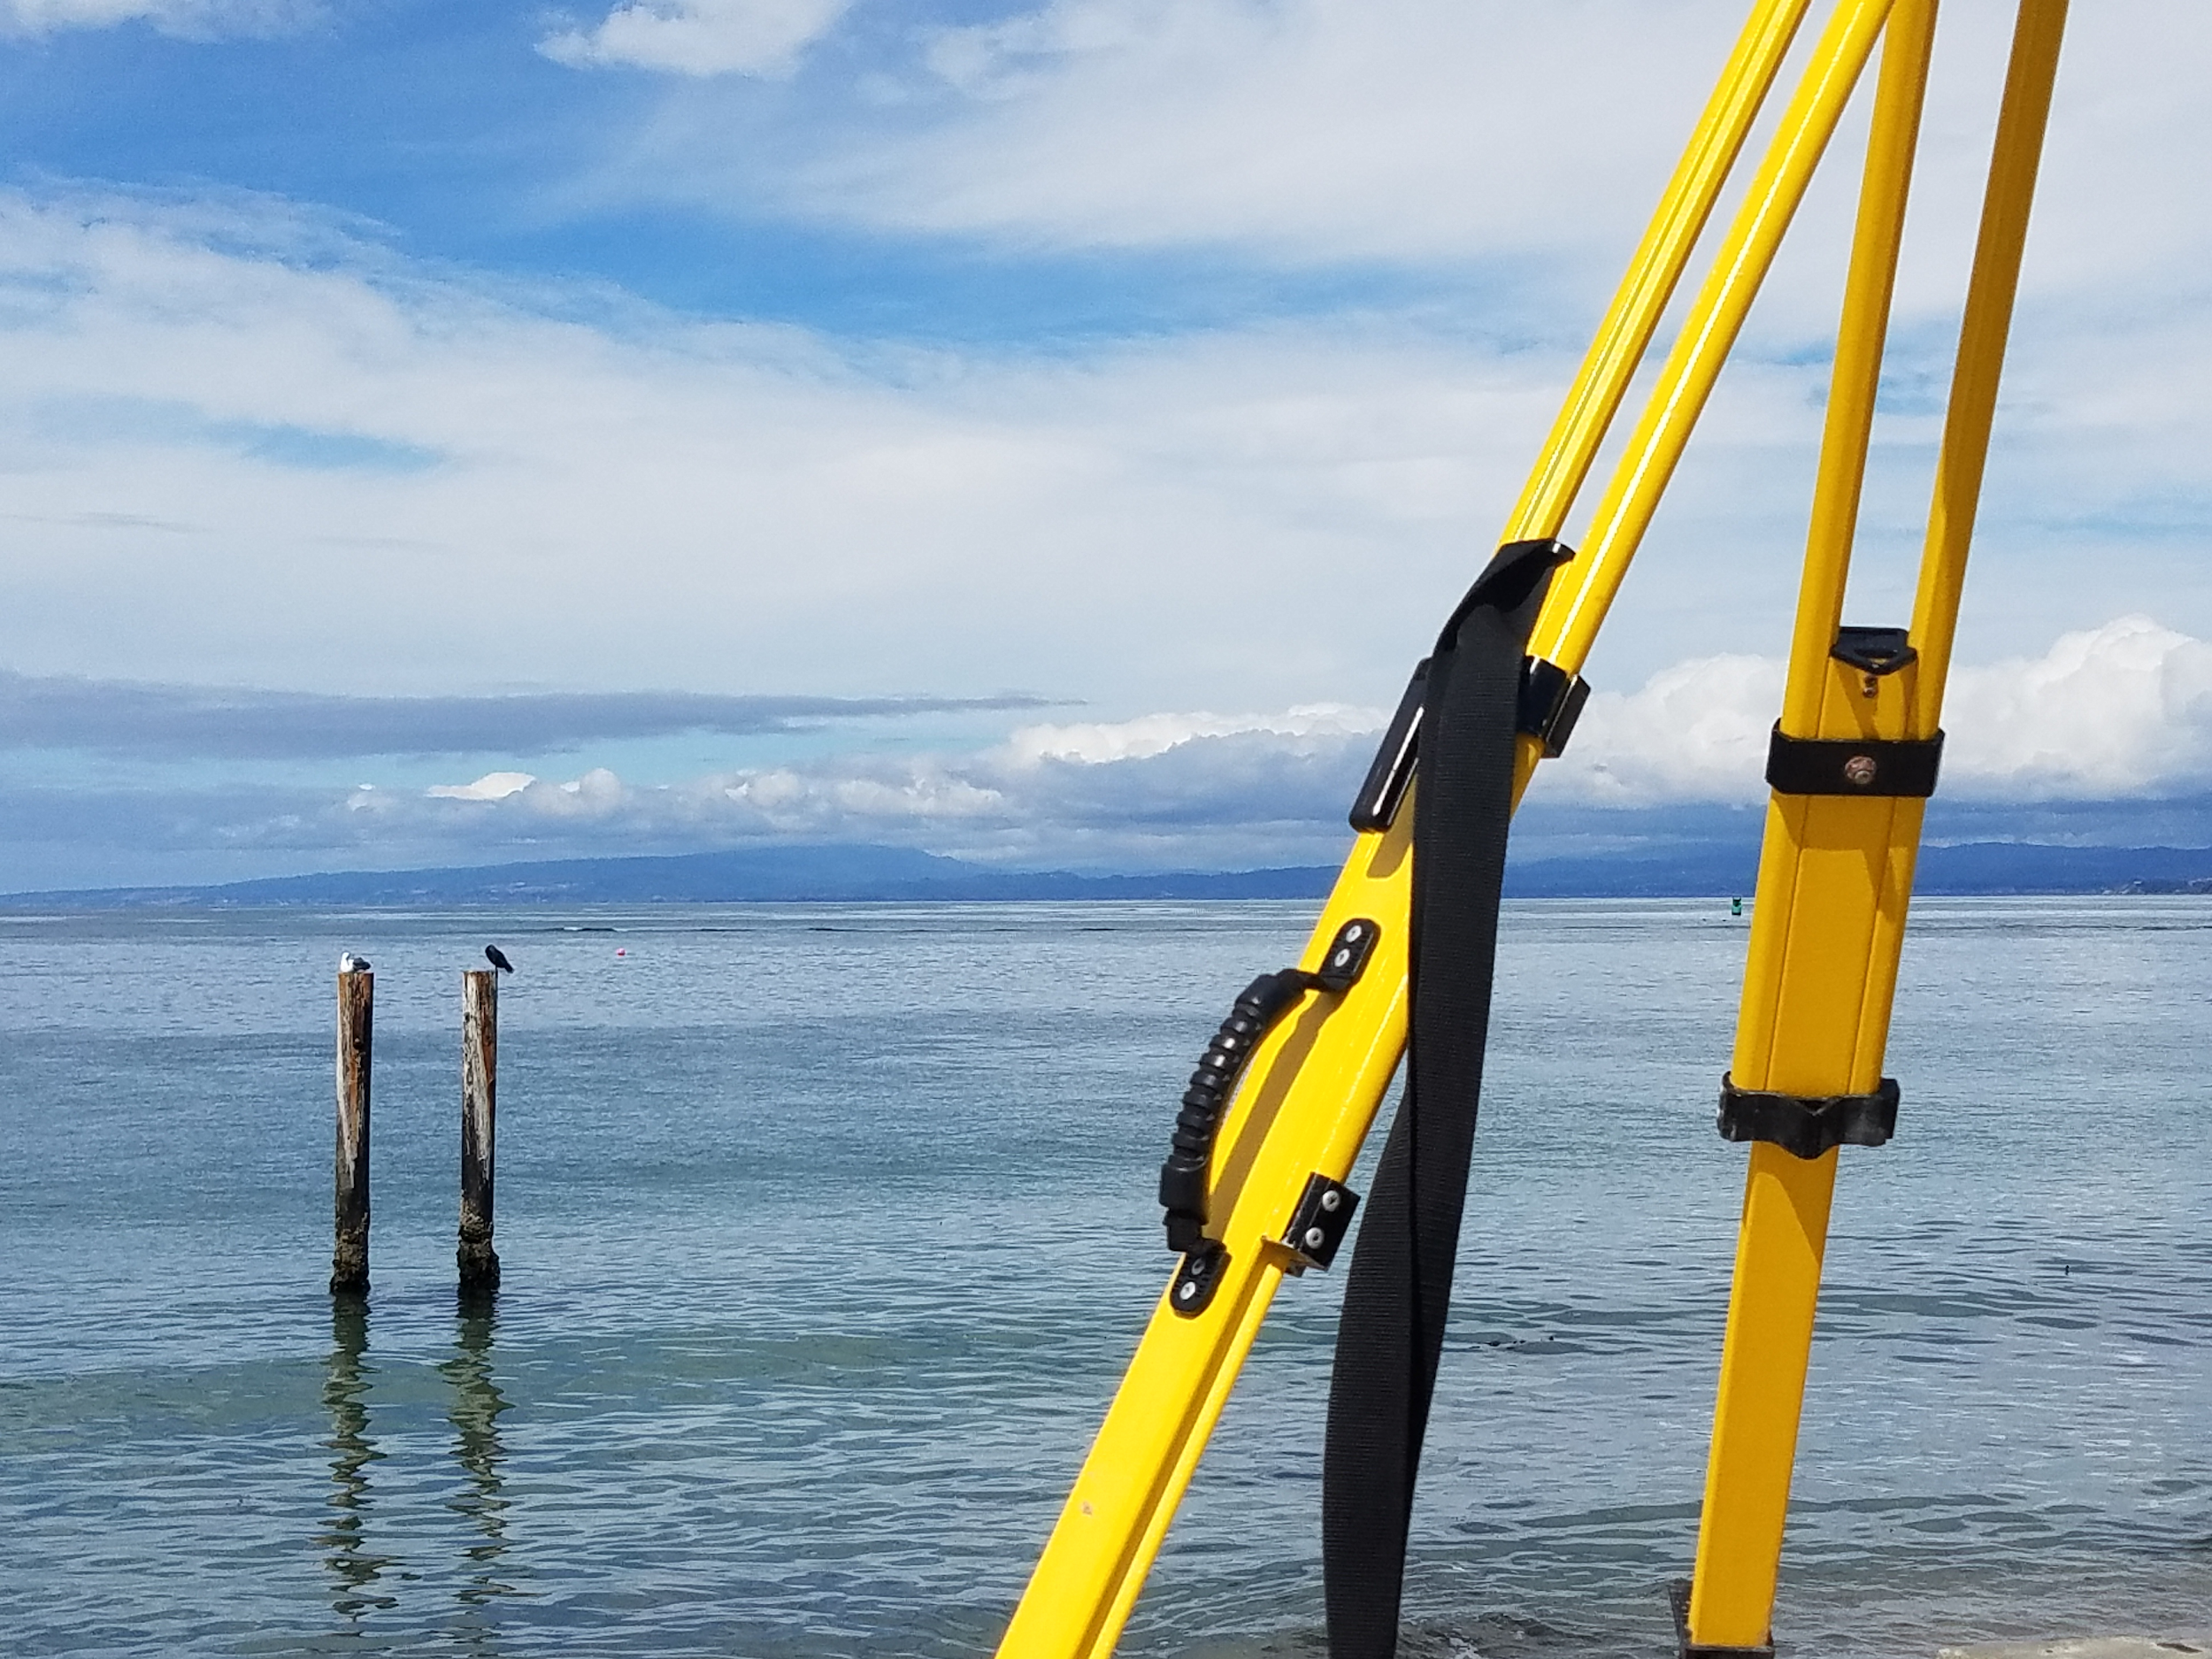
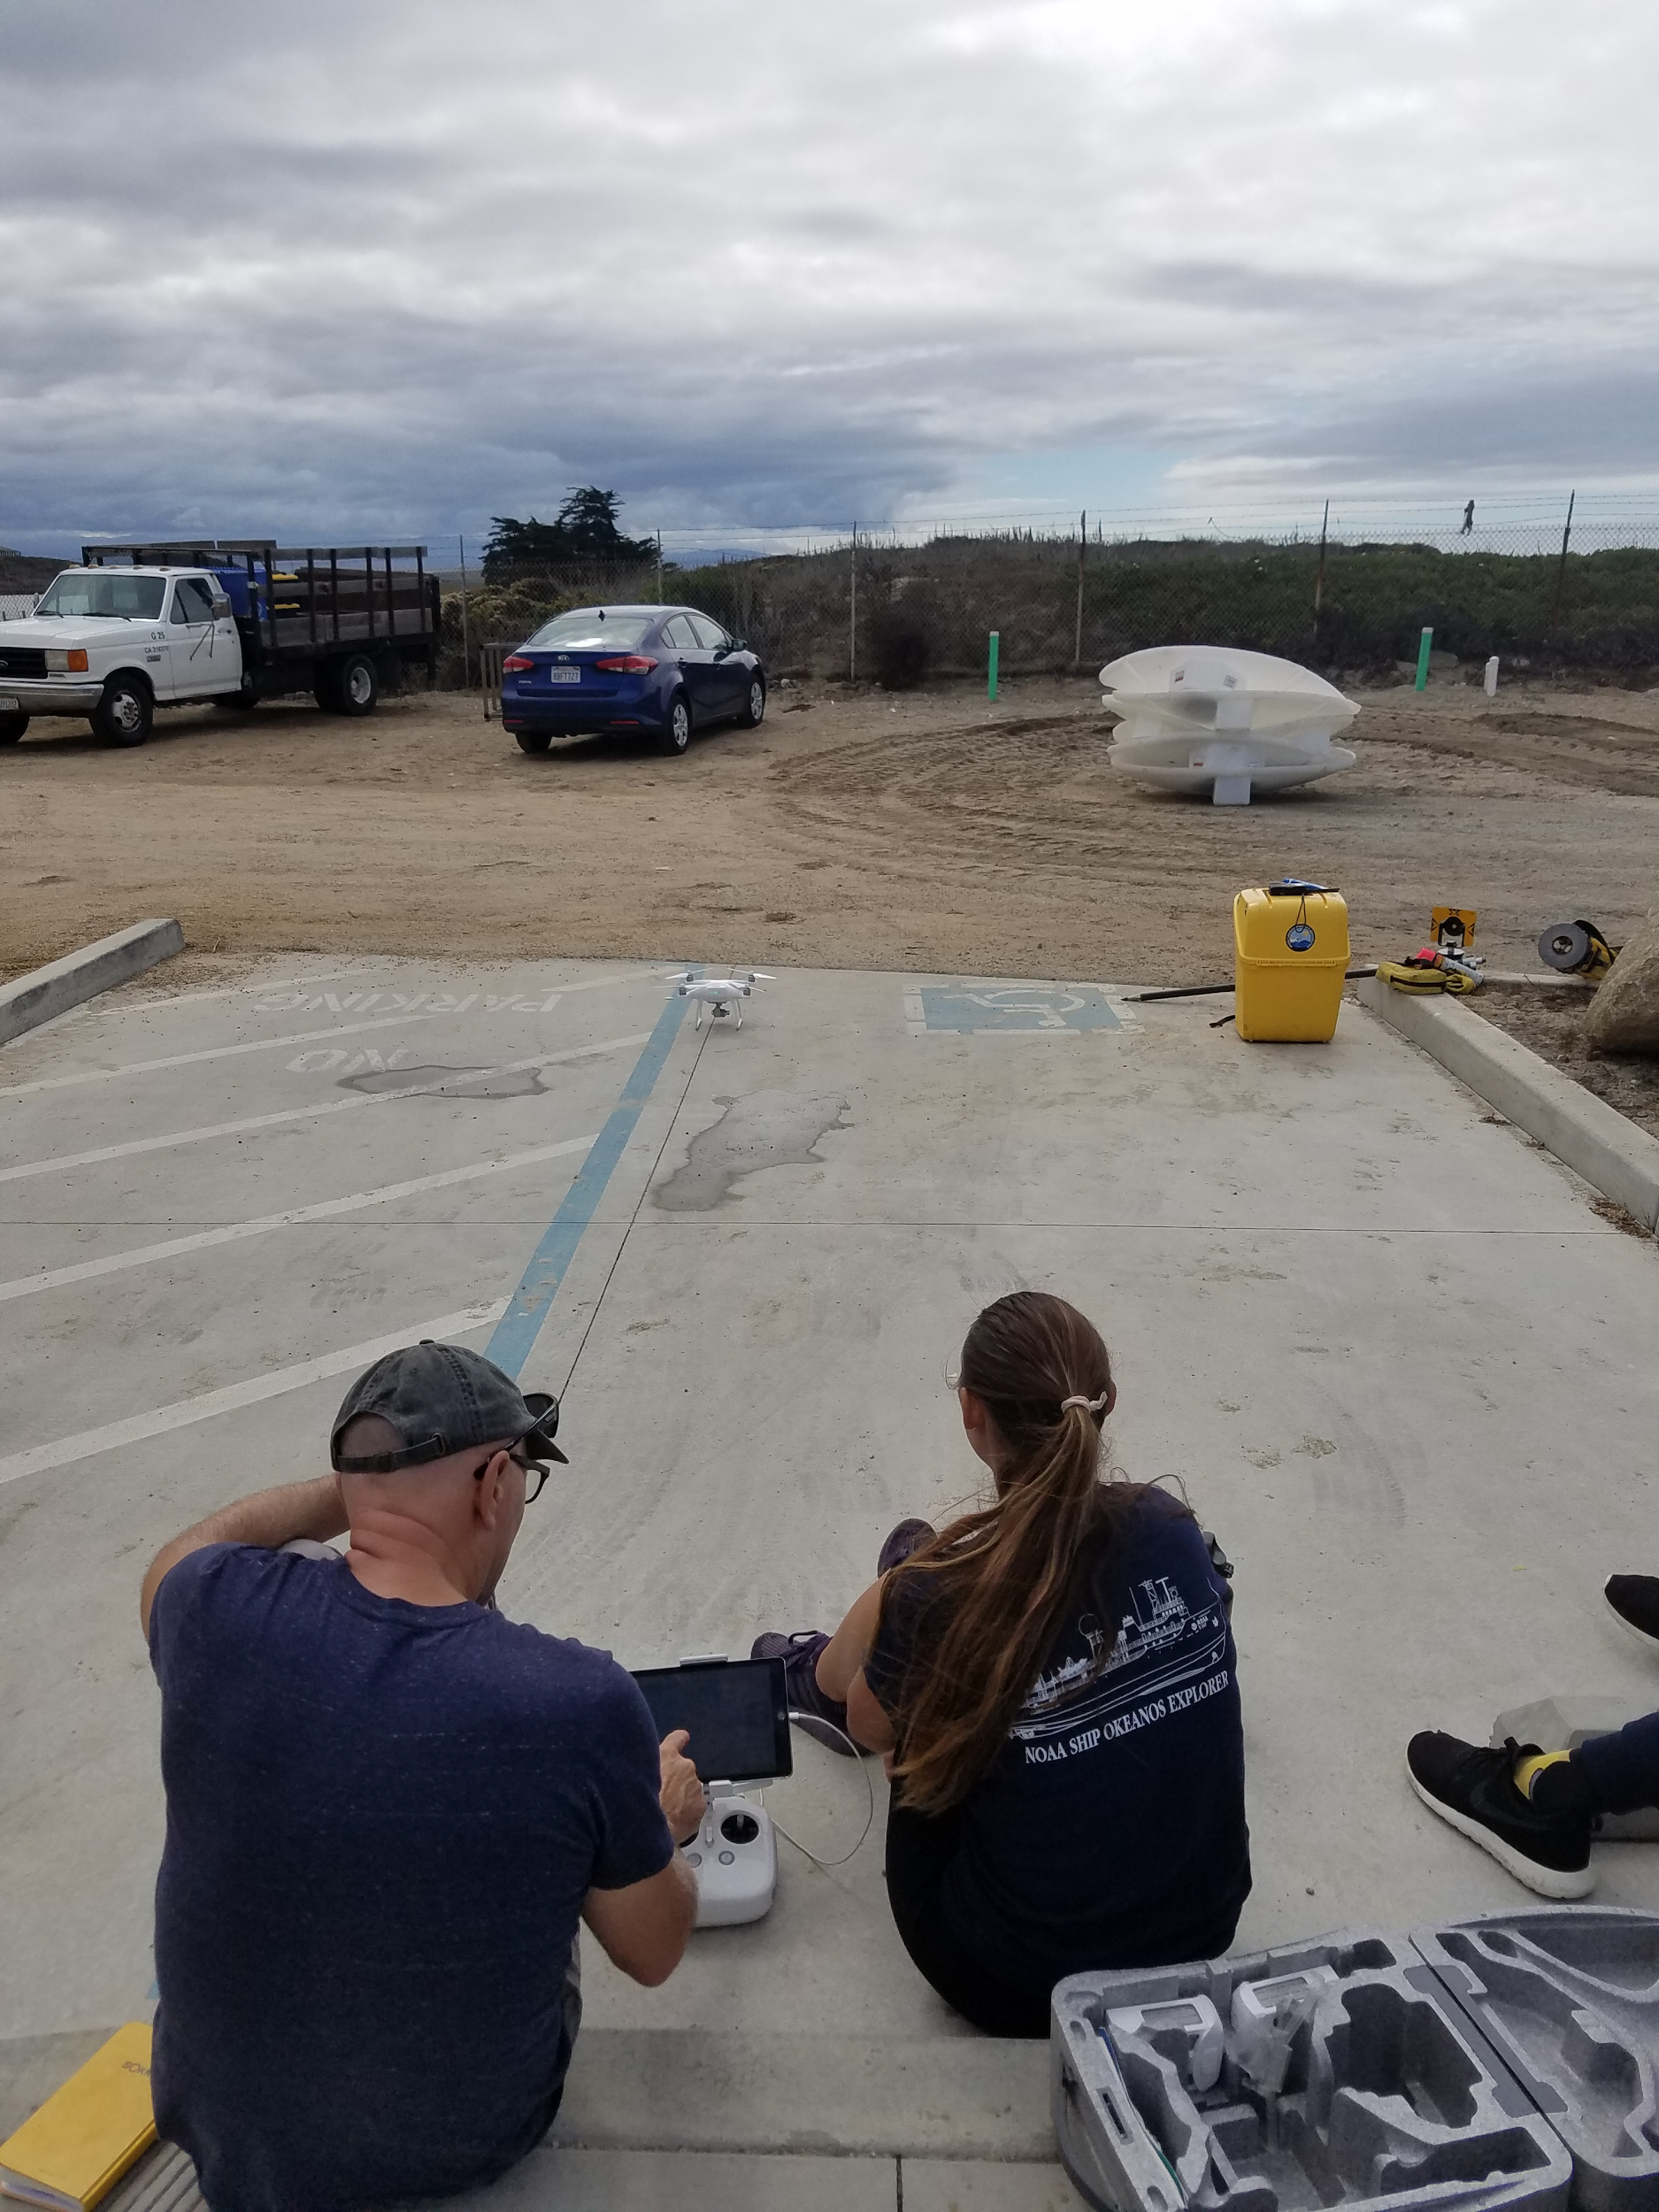
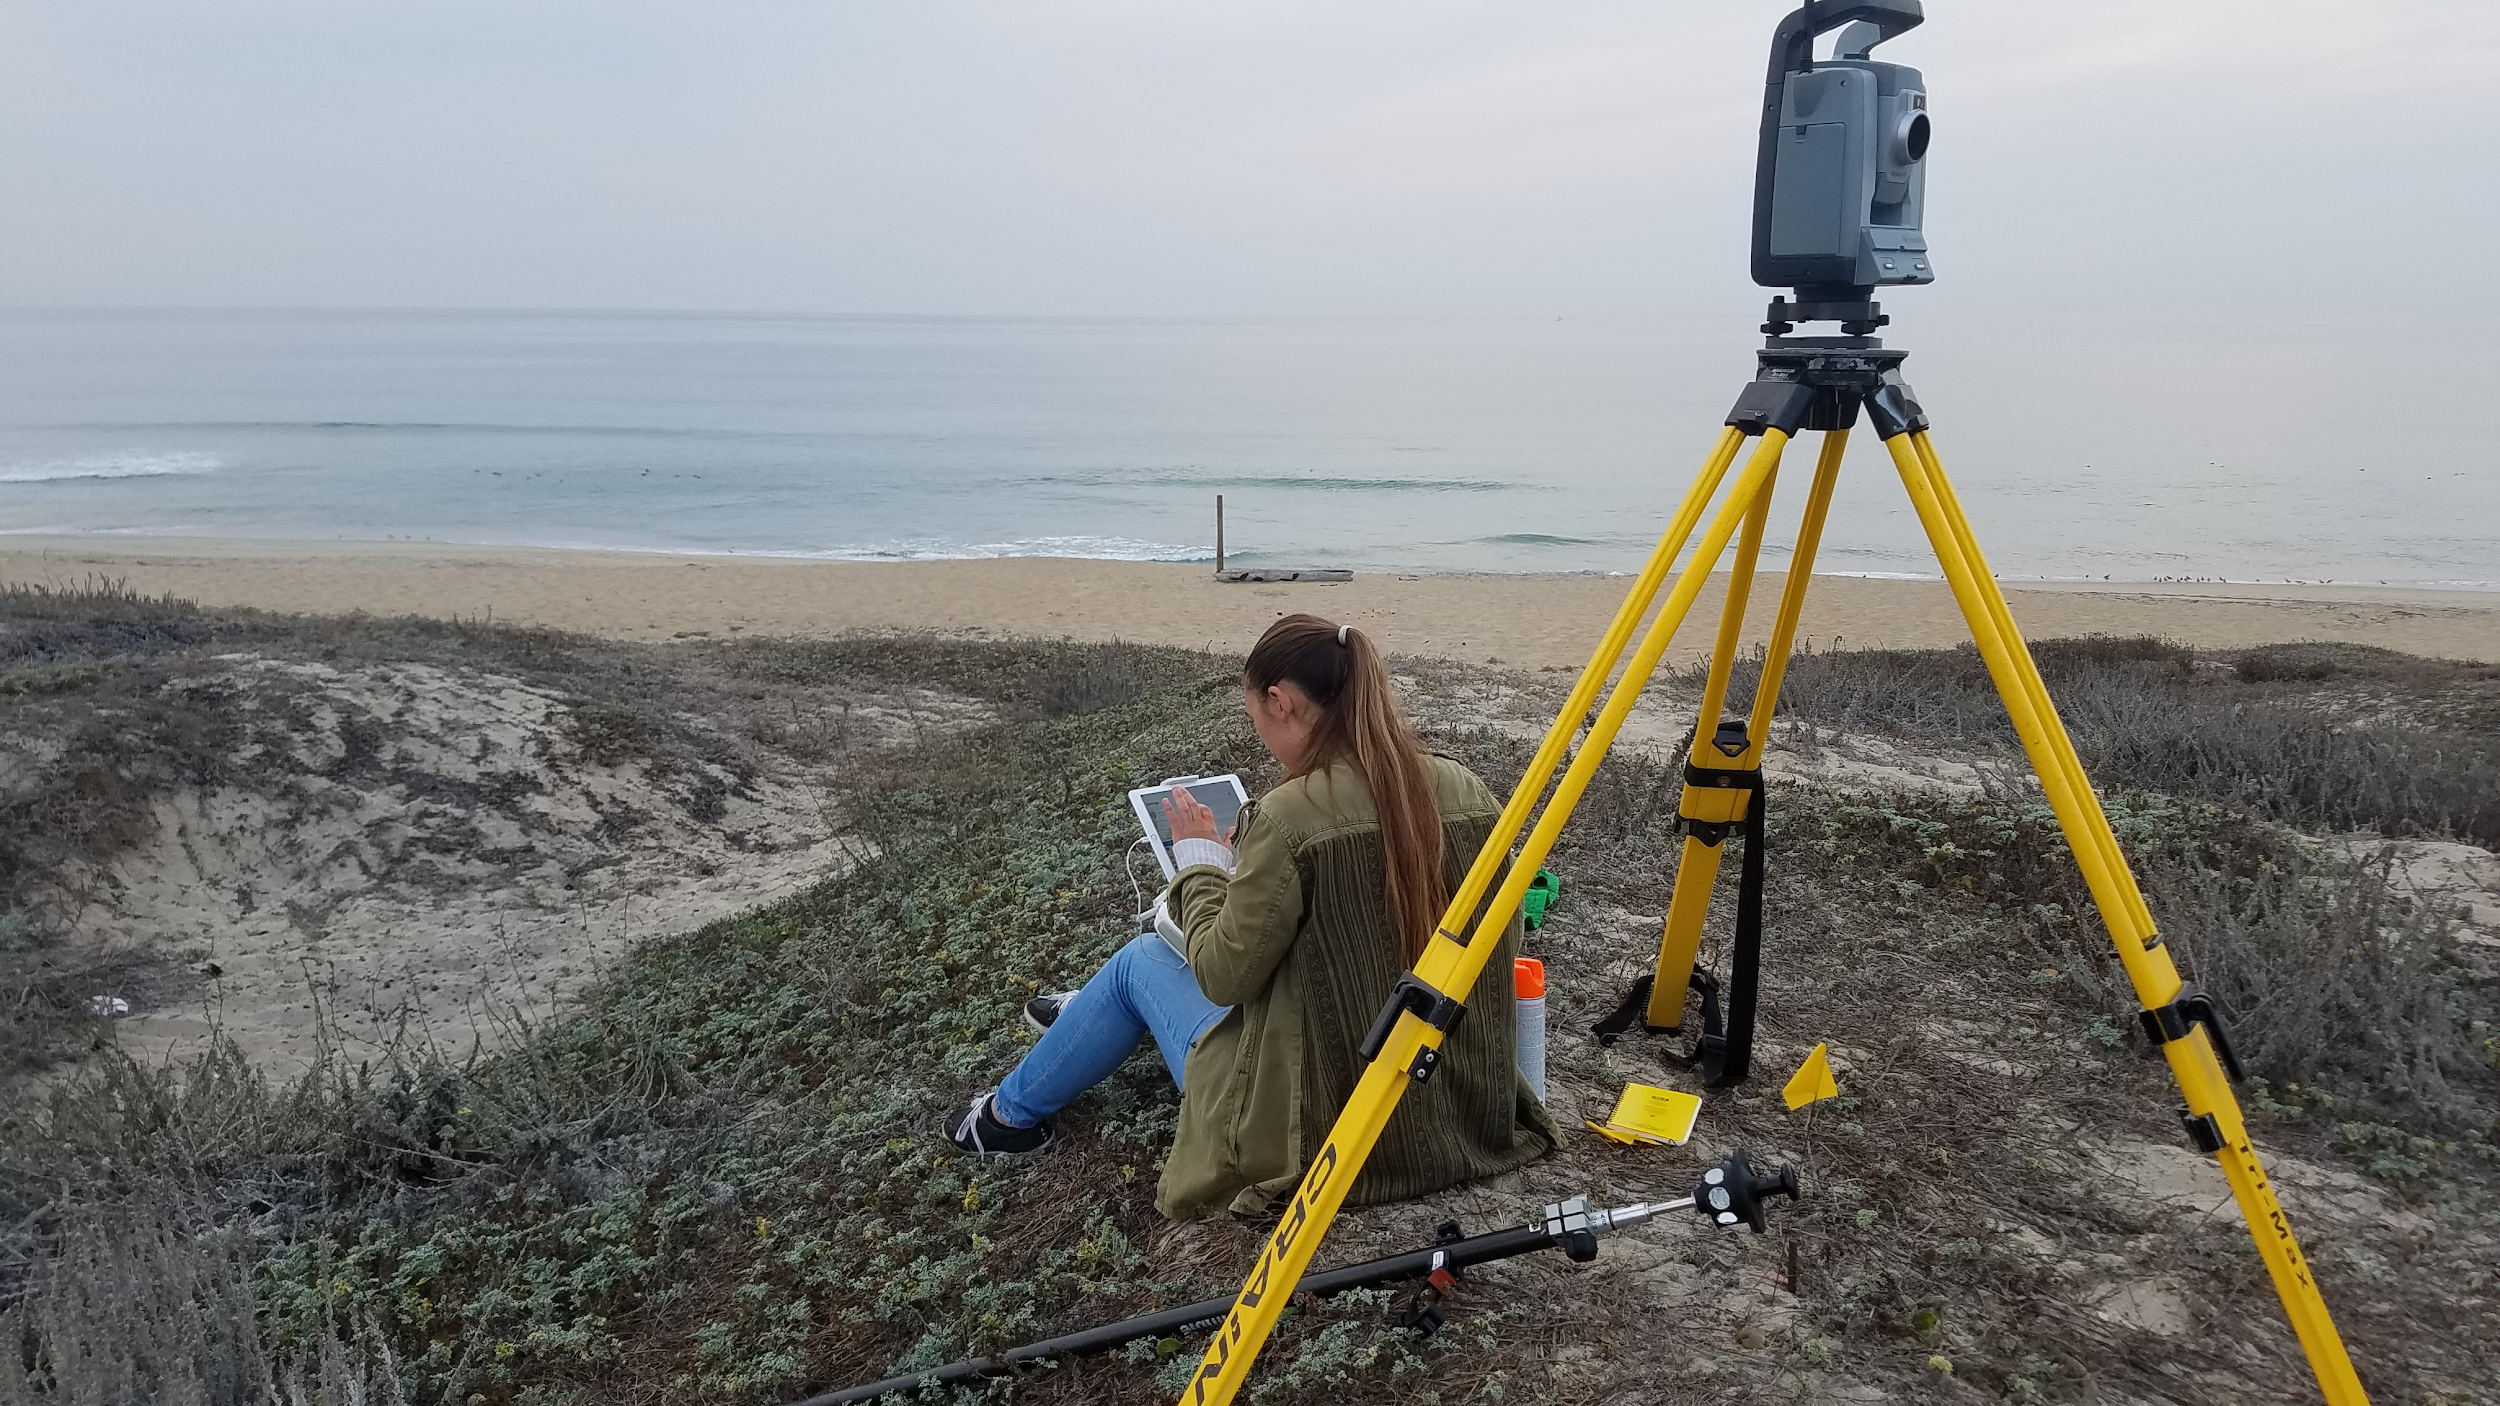
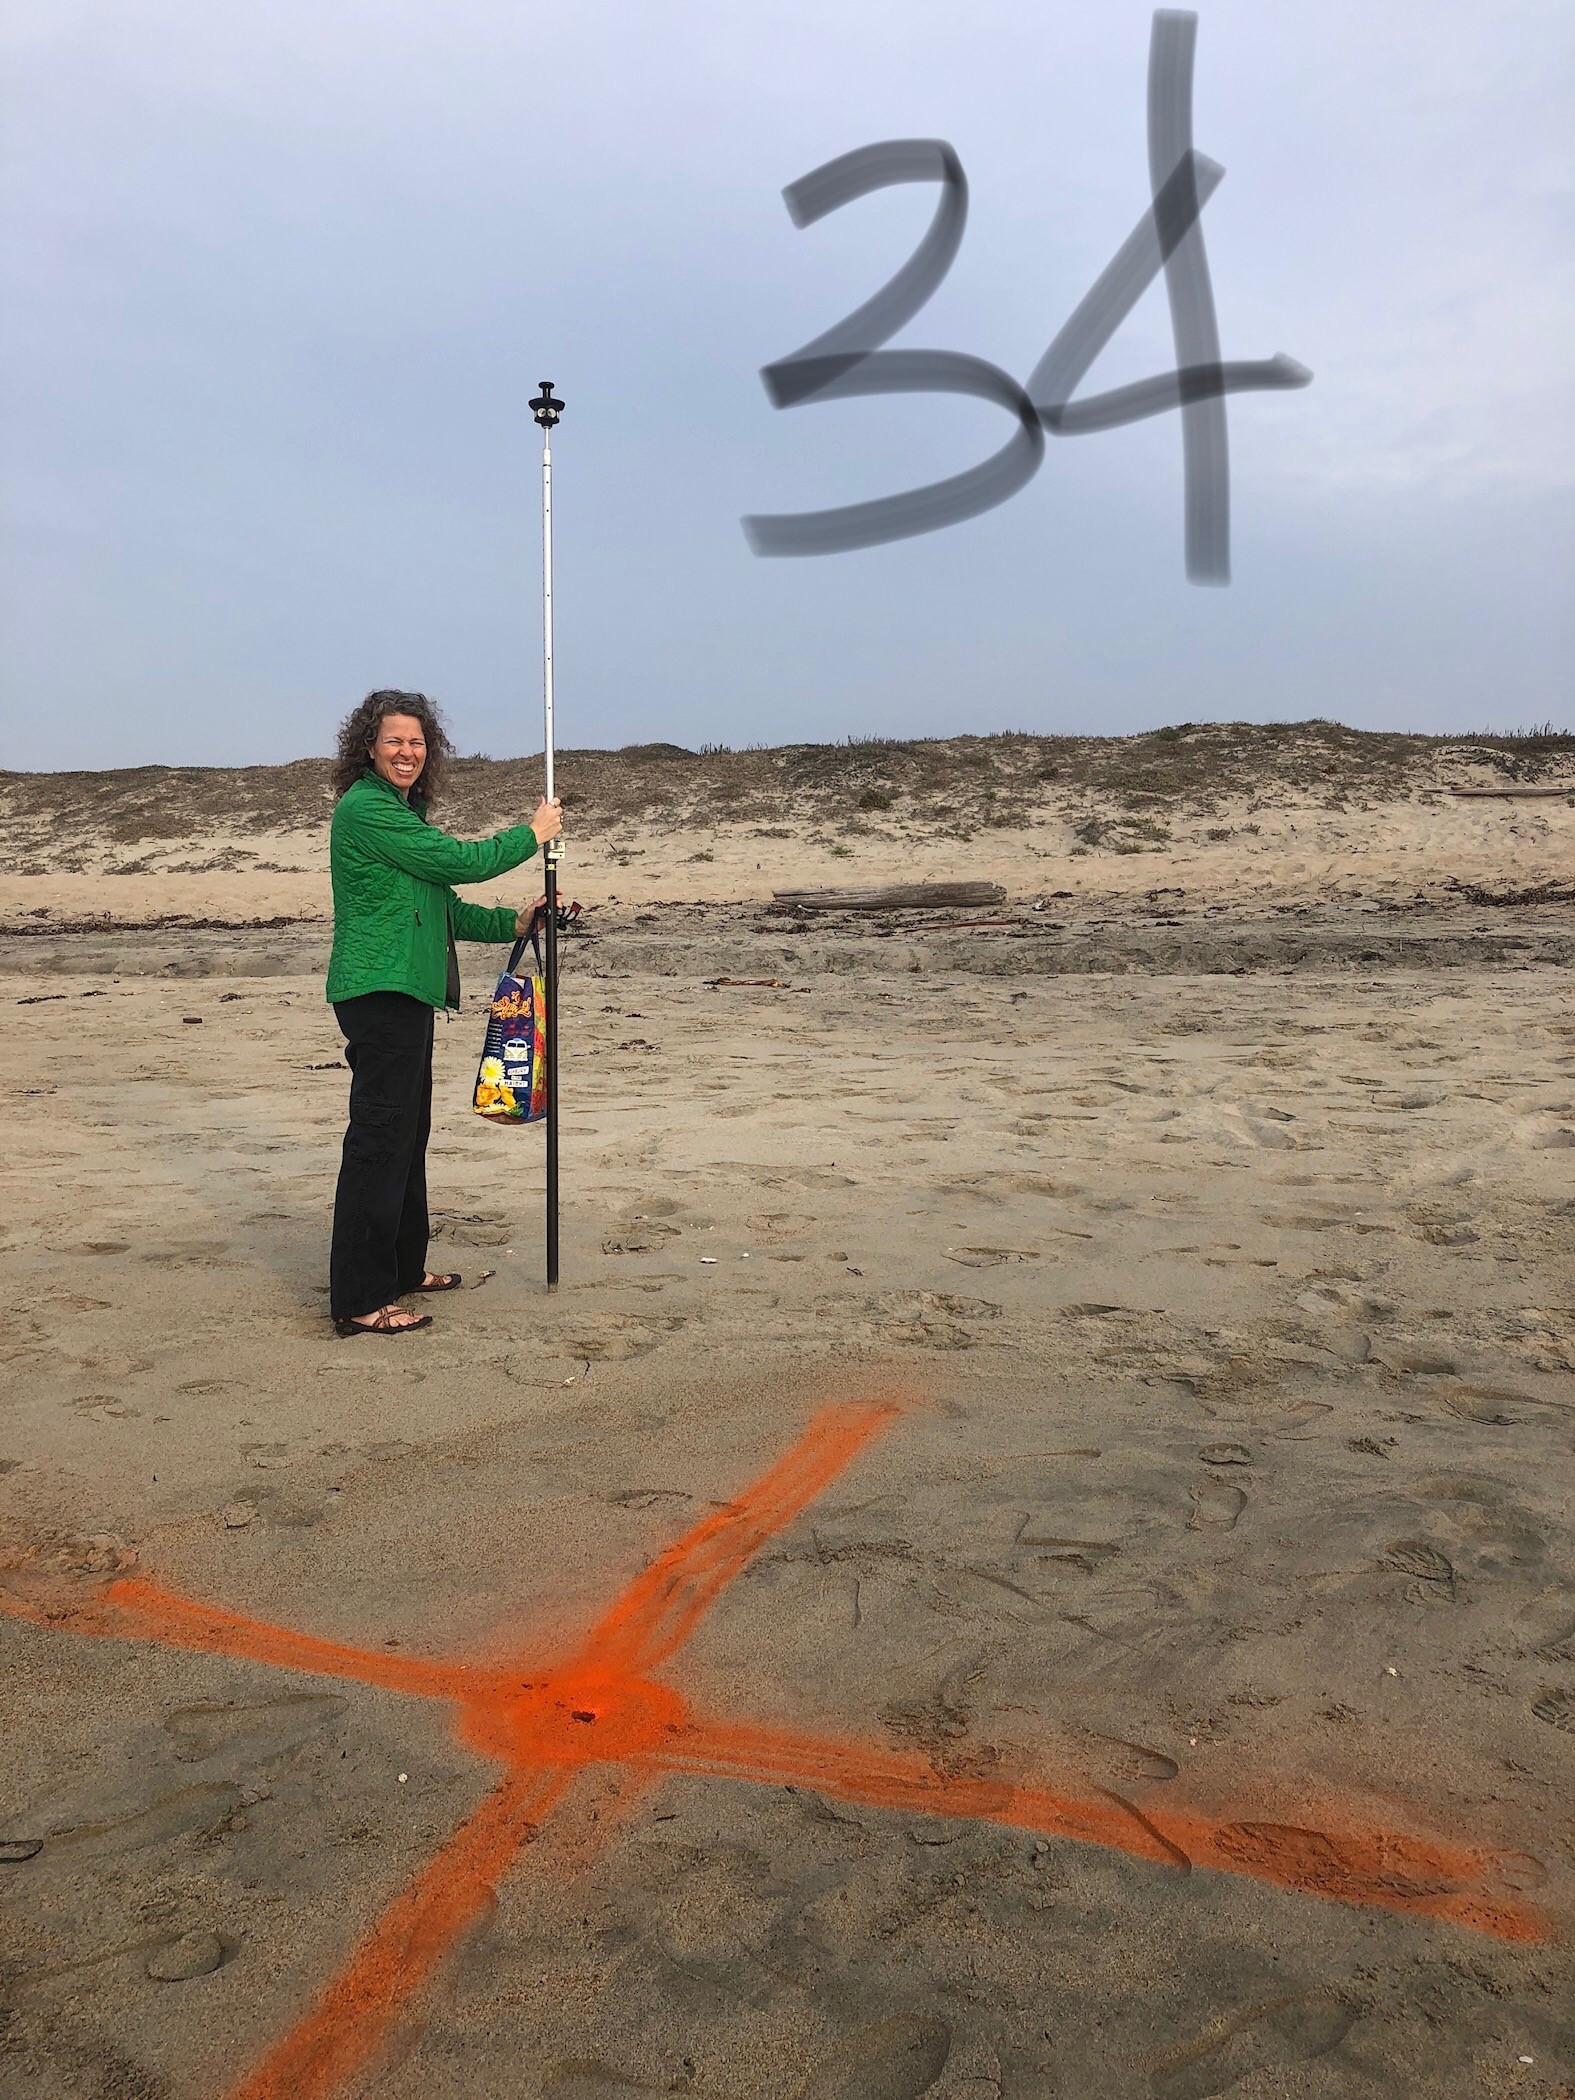
In order to survey an area, the protocol is to set up specific ground control points for geospatial accuracy. We did this by using a Terrestrial Laser Scanner (TLS), a GPS, and some spray paint. We spray painted marks on the beach where we plotted ground control points with the TLS, and then flew a drone to take pictures of the dunes and the marks on the beach.
Back at the lab, we identified the ground control points from the drone photos using Pix4D software. Pix4D evaluates the quality of our survey data, and if the quality report looked good, we could move on to verifying our accuracy in comparison to the data from 2015. We did this by finding the same geographical points on each survey and confirmed that the didn’t differ by more than a few meters.
Unfortunately, we had some trouble with the pre-processing of our drone surveys of survey Area 2 (Area 2) in Pix4D. We found out (after attempting to survey the same area multiple times) that the camera optimization parameter was off. Thankfully, this was an easy fix, and we could still salvage the survey data from that location.
We made some beautiful figures of our raster calculations comparing elevation changes from 2015-2016, 2015-2018, and 2016-2018 for both survey areas. For clarity and elucidation, we narrowed it down to the elevation changes from 2015-2018 in both locations.
Getting ready to fly the drone in survey Area 2, south of Protrero Beach entrance (Amelia Labbe)
Using ArcMap, our 2018 drone surveys, and the CCWG 2015 drone surveys, we could analyze how much the dunes have changed due to weather events, erosion, ice plant removal, etc.
Since survey Area 1 (Area 1) has not had dune restoration in more than 20 years, it served as a control area and an opportunity for us to learn about dune changes and familiarize ourselves with the Pix4D and ArcGIS software. Figure 1 shows changes in elevation from 2015 to 2018 in Area 1. For this comparison, we used a raster calculation in ArcMap. It is important to remember that dunes shift naturally, so if even the face of the dune shifts forward or backward by a couple of centimeters, it can appear as a drastic change in elevation.
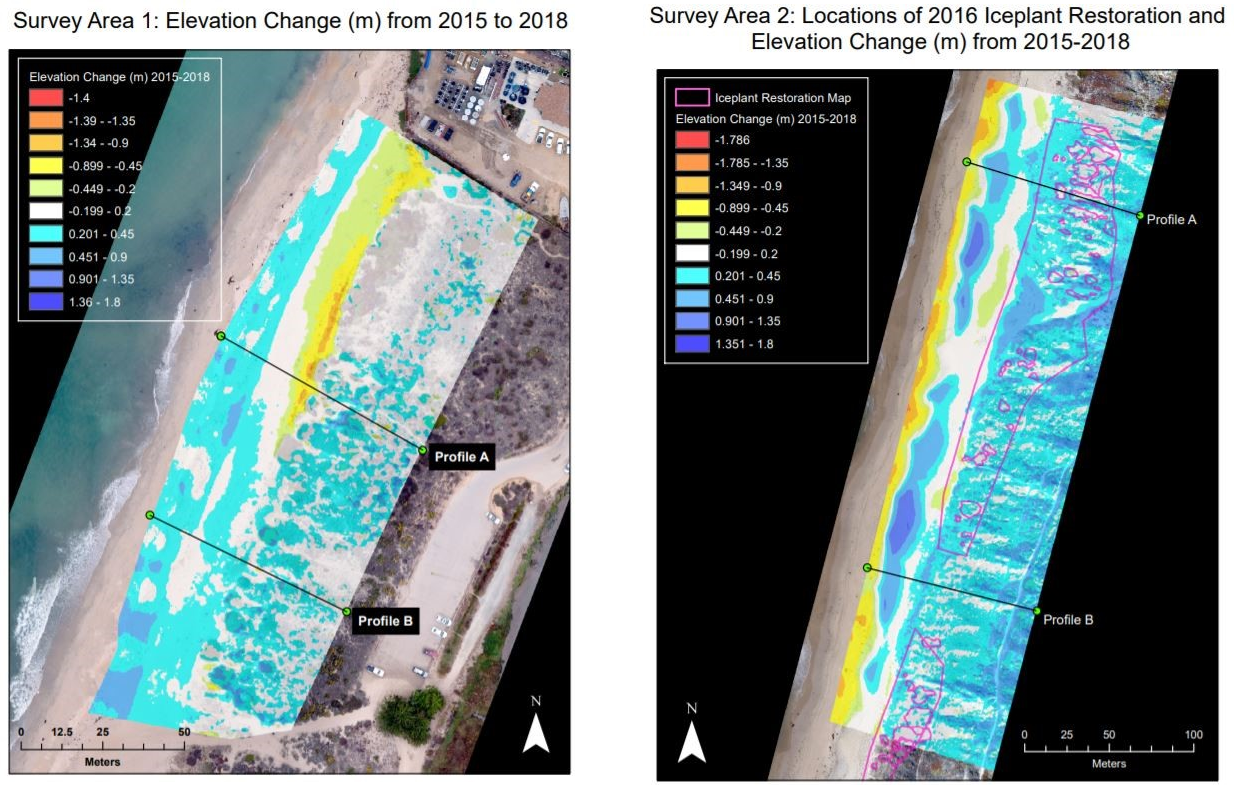
Figure 2 (right). Survey Area 2 serving as the experimental location
On the face of the dunes in survey Area 2 (Figure 2), we can see more accretion than erosion. The CCWG implemented dune restoration in the polygons outlined in pink. The restoration aimed to decrease the rate of dune erosion on the face of the dunes. In Area 1 (Figure 1), we can see elevation loss at the face of the dune. High wave energy is associated with natural erosion dune faces. Area 1 is located adjacent to the head of the Monterey Bay Canyon where it is exposed to higher wave energy than areas further south, explaining the erosion in this location. The back of the dunes in Area 1 experienced very little change in elevation, while in Area 2 (Figure 2), we see a fair amount of accretion. This may be due to the offset of the processed file having a possible bias towards accretion in this zone.
In Figures 1 and 2, we took cross sections of the elevation changes at locations ‘Profile A’ and ‘Profile B’. We then made profile graphs of these changes in Arcmap (Figures 3 and 4).
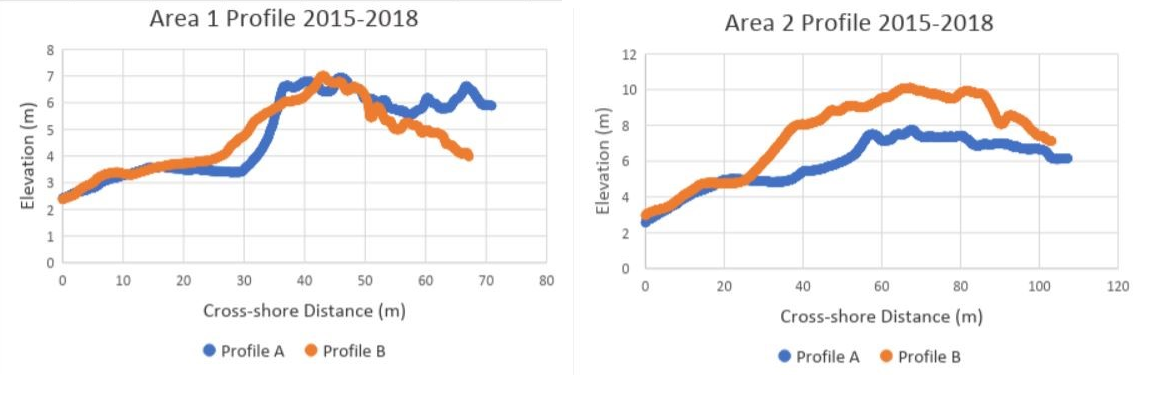
Figure 4 (right). Survey Area 2 profile of beach/dune elevation changes in locations A and B.
These cross sections show how much height was gained (positive numbers) or lost (negative numbers) between 2015 and 2018. In figure 3, Profile A shows erosion at the face of the dune (~30m cross-shore distance), which is typical at high wave energy zones. In both of the profiles in figure 3, we do not see a wide range in elevation changes until they cross the face of the dune. In figure 4, just a few meters from the shoreline, these profiles show that there is a relative trend toward accretion. In the same figure, we can also see that the accretion is higher in profile B at the face of the dune (~30m cross-shore distance), where there was no dune restoration. It is important to note that the removal of ice plant is not scientifically proven to decrease erosion rates or increase accretion rates.
What we can hope to accomplish in thefuture
In the future, we can continue to monitor dune morphology using drone surveys as the restoration progresses. We can see if the type of restoration has any influence on how much accretion appears on the dunes. We can also survey at a smaller scale to understand exactly how much erosion of the dunes is associated with ice plant.
Overall, this project helped us both learn about how to survey beaches and dunes using a TLS and a drone. We spent countless hours on ArcMap and Pix4D and have learned more about the programs than we thought we were capable of. We want to give a huge thank you to Ivano Aiello for helping us every step of the way and to the CCWG for giving us valuable information and continuing to preserve our land. Also, a huge thanks to Miya Pavlock-McAuliffe for helping us with ArcMap and thanks to David Carpenter for making some beautiful crosses on the beach.