Bar-Built Estuaries of California
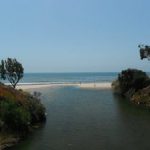
Bar-built estuaries (BBEs) are located at the terminus of creeks and rivers where a wave-built sand barrier restricts connection with the ocean.
What are Bar-built Estuaries?
Bar-built estuaries (BBEs) are located at the terminus of creeks and rivers where a wave-built sand barrier restricts connection with the ocean. The formation of this sand barrier is driven by a dynamic set of processes that vary regionally and seasonally depending on watershed and climate, river inflows, river sediment load, tidal flows, nearshore sediment supply, wave exposure, and development (including transportation infrastructure). The constricted mouths of BBEs constrain tidal exchange between the estuary and the ocean and modify estuary hydrology. These mouths close periodically, completely separating the estuary from the ocean and impounding water within a lagoon (a coastal lake), with water surface elevations that may rise above high-tide levels in the ocean (Behrens et al. 2015b). The frequency and duration of inlet closure varies naturally across BBEs and across years. The mouth state is not binary (fully open or fully closed) as these systems transition among multiple mouth states, including non-tidal phases (closed mouth), perched overflow, tidal choking (muted tides relative to ocean), and fully tidal (fully open mouth).
The salinity regime of a bar-built estuary can be highly variable, exhibiting tidal fluctuations when open and different BBEs can be entirely fresh, vertically stratified or entirely hypersaline when closed, dependent on the hydrological balance and the condition of the sand barrier at the mouth of the system. There is a trend toward lower salinities in more northern estuaries where a positive water balance is the result of higher rainfall and river inflow, and higher salinities in southern California estuaries – but conditions also depend on watershed size and yield. Intense, two-layer salinity stratification is common in these systems when the mouth is closed or in transition (perched or muted mouth states).
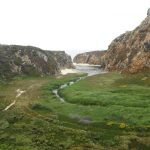
California’s bar-built estuaries afford unique habitats with a wide range of special ecological services. Further, a suite of species listed as threatened or endangered under the federal Endangered Species Act (ESA) depend on these habitats, including the tidewater goby, Belding’s savannah sparrow, steelhead trout, and Western snowy plover. In addition, benefits accrue to local human communities such as recreation, flood attenuation, and water filtration. Depending on the local geology and the degree of confinement by adjacent uplands, these systems may support spatially extensive wetland habitats and resources, or they may support only a narrow estuary comprised of an open water channel.
BBE Management Considerations:
Water impoundment behind the sand barrier can conflict with some site-specific environmental or land-use objectives. Municipalities and resource managers routinely manage mouth state to protect specific environmental conditions or adjacent property. When undesirable water elevation or water quality triggers active management, there are limited options other than implementing a managed breach. Permits are applied for and issued on a case-by-case basis to address a variety of management purposes (e.g., alleviate impacts of flooding, improve estuary water quality, improve conditions for wildlife, improve public access).
CCWG, in collaboration with Bodega Marine Lab, authored a report describing Considerations for Management of the Mouth State of California’s Bar-built Estuaries
Interactive Map of BBE data
Bar-built Estuaries around California

Description of Data types that have been collected:
CCWG has been collecting standardized data in California's BBEs since 2011. We have visited over 100 of these estuarine systems. Below is a description of the various data types that have been collected.
Data Compilation Summaries
- The Data Compilations serve to summarize a suite of data types collected at each BBE. They can serve as a report card on BBE condition. The following data types are included:
- California Rapid Assessment Method (CRAM) attribute and index scores (more info available here)
- documentation of 10 special status species of interest
- watershed landuse cover
- historical habitat change analysis
- Composite water graphs were generated for each estuary individually, and pull from a variety of data to show how each parameter changes through time. Parameters include water level, temperature, marsh minimum, maximum, and average elevation (from Trimble Juno GPS points), mean higher high water elevation (from NOAA), flooding periodicity, river gage height (from the USGS when available), rainfall (from NOAA’s GHCN), significant wave height (from CDIP), and dominant wave direction (from CDIP). Coupling all this data into a single figure for each estuary provides a broad and exhaustive summary of the system and some of its closely linked drivers.
Special Status Species:
- An investigation of the California Natural Diversity Data Base (CNDDB), local recovery plans, reports on locations of species status and input from local researchers documented (or assumed high probability) the presence of ten special status species (listed as species of concern or under the state or federal endangered species act) of interest within the studied estuaries. An Excel file documenting the results of the investigation can be downloaded: here
Sediment Grain size analysis
- Beach sediment samples were collected just under the surface of the sand. Collections took place along 4 transects running perpendicular to the ocean, distributed on each side of the channel between the estuary and the ocean. Each transect included three samples; one at the shore face (A), one at the top of the beach berm (B), and one from the runnel at the back edge of the beach (C). An Excel file documenting the results of the investigation can be downloaded: here
Water quality-vertical profile data
- Point in time water quality profiles (dissolved oxygen, temperature, and salinity) were measured at three locations along each of three cross sections of the BBE main channel equal distance between the mouth and the upper limit of estuary impoundment using a YSI water quality multi-meter. Measurements were taken at the surface and at 2–4 incremental depths to the bottom, depending on total channel depth. The Water quality-vertical profile data file can be downloaded: here
Current/Historical Habitat Mapping
- The habitat change analysis used 19th century T-sheets (ArcGIS rectified) to compare with current imagery and wetland inventories including the National Agriculture Imagery Program (NAIP) maps and the National Wetland Inventory. At each site, a polygon shapefile was drawn to encompass what we determined was the maximum extent of the specific BBE for both the current and historical condition. Inland extent was determined using multiple lines of evidence including the 10 foot elevation contour, a narrowing of channel width, a change in vegetation type, and in some cases, the inland extent of our inventory was determined by the inland coverage of the 19th century T-sheet maps (especially larger systems). Lateral extent was determined by looking at topographic indicators and the presence of surface waters that are physically/hydrologically connected to the channel. Current/Historical Habitat Mapping GIS file can be downloaded: here
- CCWG used its own habitat classification scheme for this project. Click here to download the classification scheme.
Watershed landuse data:
- Landscape level investigations of potential stressors were be conducted for each estuary. The watersheds of each estuary were demarcated using Watershed Delineation Tools in ArcGIS. The predominance of different landform modifications and land cover types that may affect the condition of downstream wetland habitat were calculated for each bar-built estuary. Watershed landuse Data Report: here
Reports on BBEs in California
CCWG Reports on BBEs
- Using New Methodologies to Assess Bar-built Estuaries along California’s Coastline
- An Inventory and Classification of US West Coast Estuaries
- Assessment and Management Prioritization Regime for the Bar-built Estuaries of San Mateo County
- Assessment of Select Estuaries of Marin County
- Considerations for Management of the Mouth State of California’s Bar-built Estuaries
- Development of a Bar-Built Estuary Monitoring and Resource Management Prioritization Tool for California State Parks
- California Bar-built Estuary Monitoring Manual

