
The Riparian Rapid Assessment Method for California (aka RipRAM)
Overview
RipRAM is a cost-effective ambient monitoring and assessment tool that can be used to assess condition on a variety of scales, ranging from individual stream reaches to watersheds and larger regions. The Riparian Rapid Assessment Method (RipRAM) relies on visual indicators to reliably assess physical and biological complexity, which is then used to infer ecological functioning and benefits (i.e. condition).
RESOURCES
Background
The Riparian Rapid Assessment Method (RipRAM) was developed in part as a response to the Central Coast Regional Water Quality Control Board’s (CCRWQCB) specific request to implement a riparian monitoring program that supports their “Vision of Healthy Watersheds.” Protection of riparian areas, including protection of canopy cover, surface waters water quality and buffer condition is predicated on a comprehensive inventory of the resources. Protection of current resources and restoration of degraded riparian areas will be greatly enhanced through the creation of a regional riparian inventory and riparian condition assessment tool.
For the purposes of RipRAM we used the National Research Council’s definition of a riparian area:
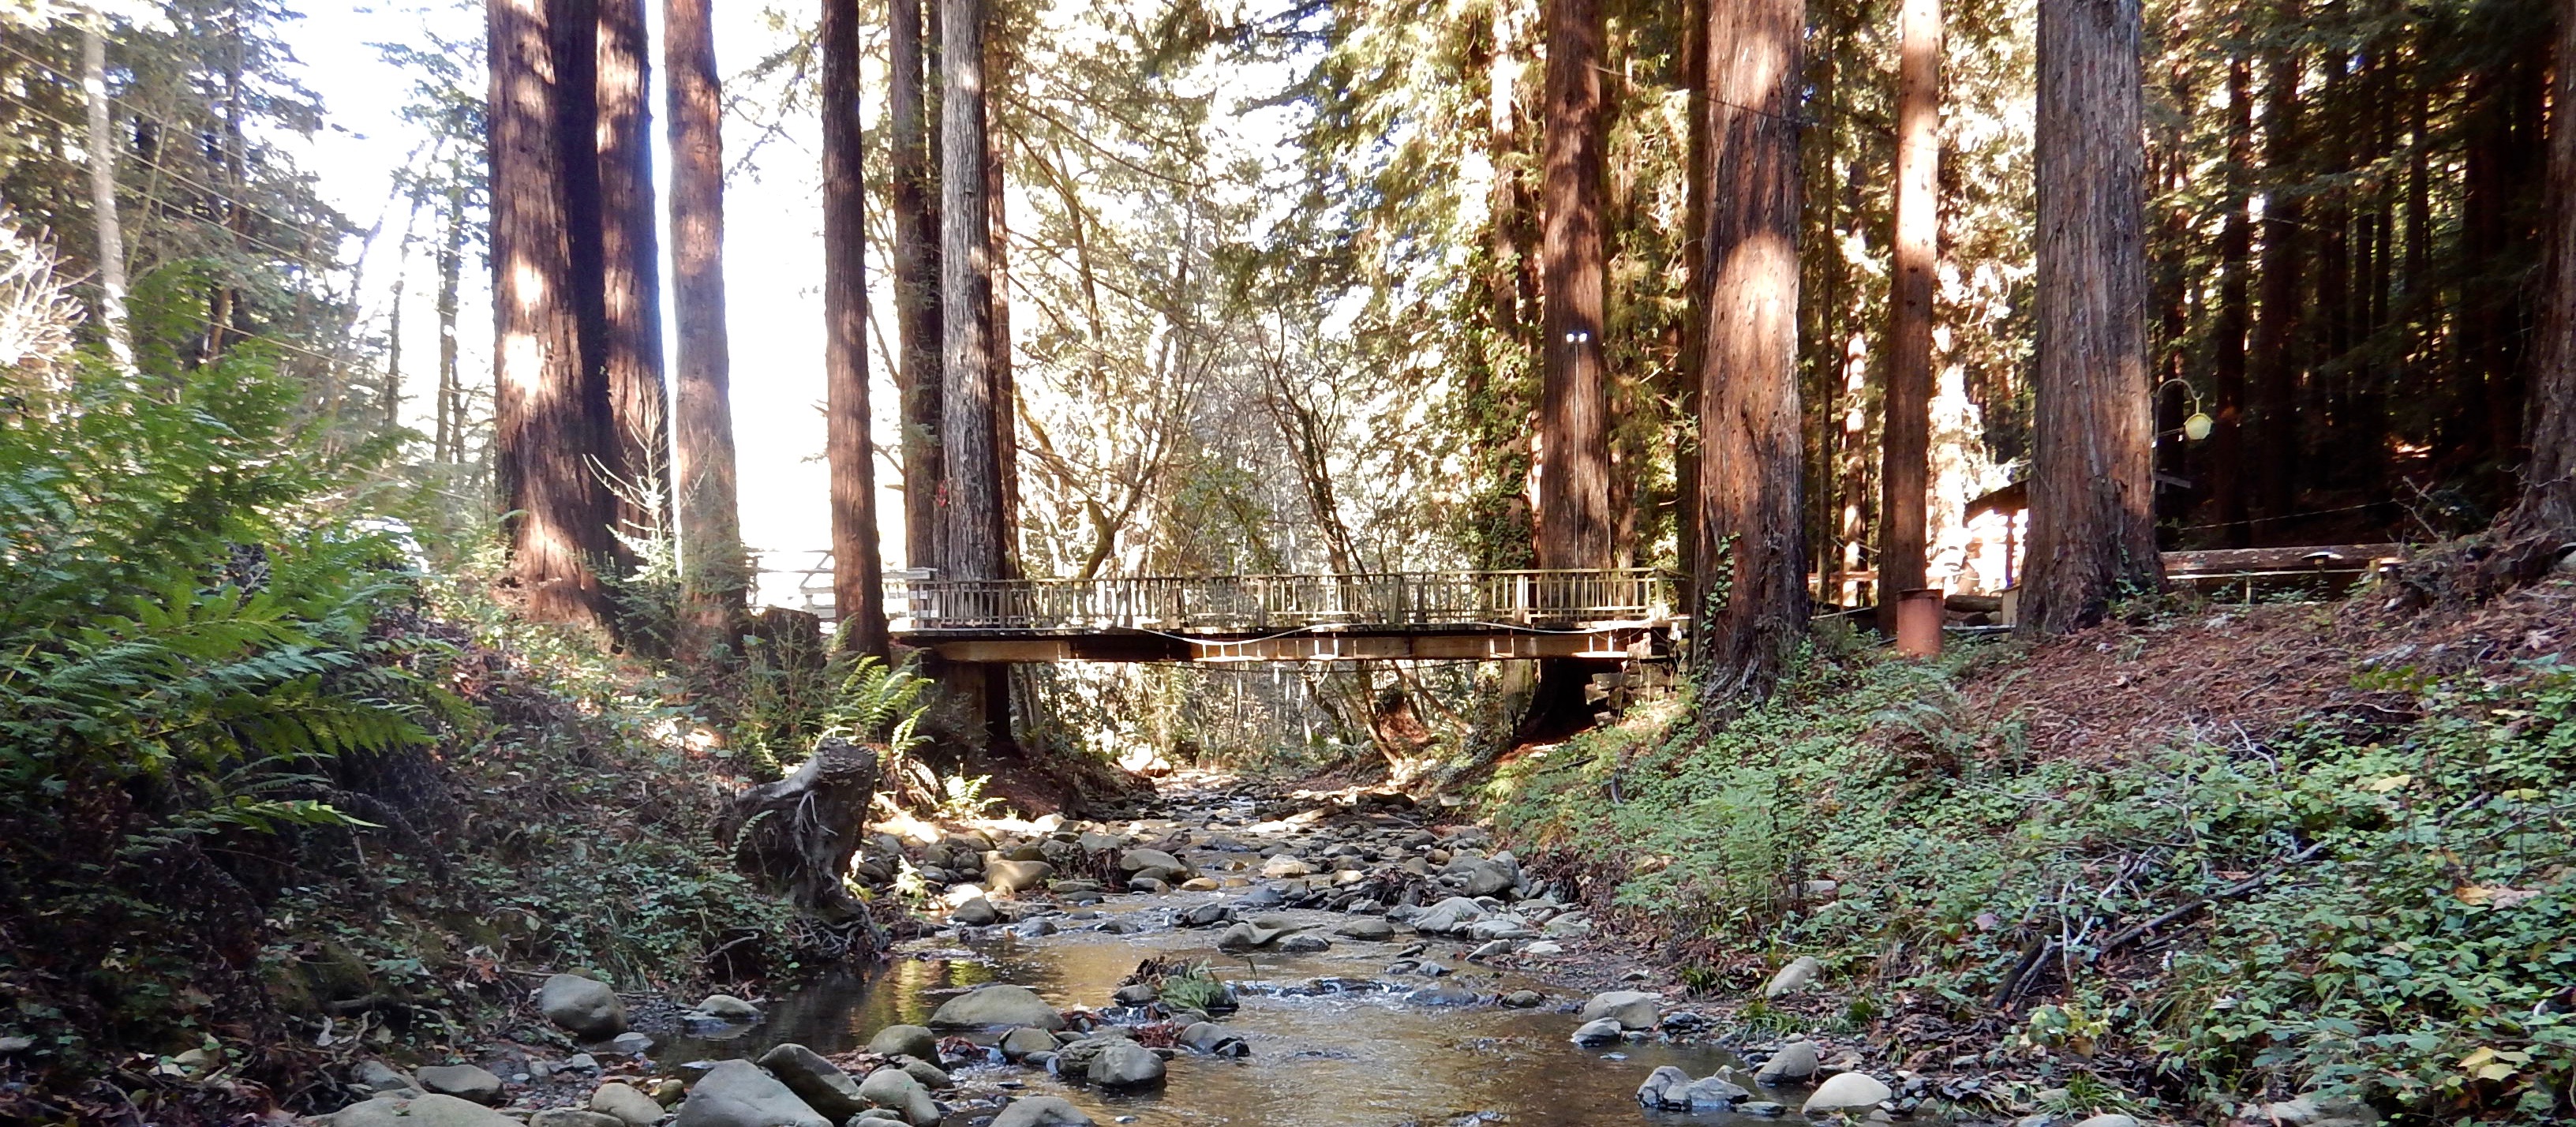
Riparian Areas are transitional between terrestrial and aquatic ecosystems and are distinguished by gradients in biophysical conditions, ecological processes and biota. They are areas through which surface and subsurface hydrology connect water bodies with their adjacent uplands. They include those portions of terrestrial ecosystems that significantly influence exchanges of energy and matter with aquatic ecosystems. Riparian areas are adjacent to perennial, intermittent, and ephemeral streams, lakes and estuarine-marine shorelines” (National Research Council 2002).
Current Development Activities (2019-2022)
CCWG has funding from USEPA Region 9 to validate the Riparian Rapid Assessment Method (RipRAM) tool, develop and test watershed condition estimation models, develop riparian zone protection and management goals, improve decision maker access to watershed condition data/information, and track progress towards meeting central and southern California riparian protection and enhancement goals. This project will help regional stakeholders and agencies to prioritize hundreds of millions of dollars of State bond money to protect, acquire and restore coastal stream and riparian habitats. Grant activities and products will increase California’s efforts to apply the Level 1-2-3 assessments for riparian zones and streams:
-L1: Define and map the reference (natural) riparian widths for central and south coast watersheds.
-L2: Validate the Riparian Rapid Assessment Method for California and create an online repository for all data incorporated into EcoAtlas.org.
-L3: Develop a methodology to incorporate L2 and L3 data the “Integrated Assessment of Watershed Health” to establish riparian habitat protection and management goals in two regions of the state.
Scoring Methodology
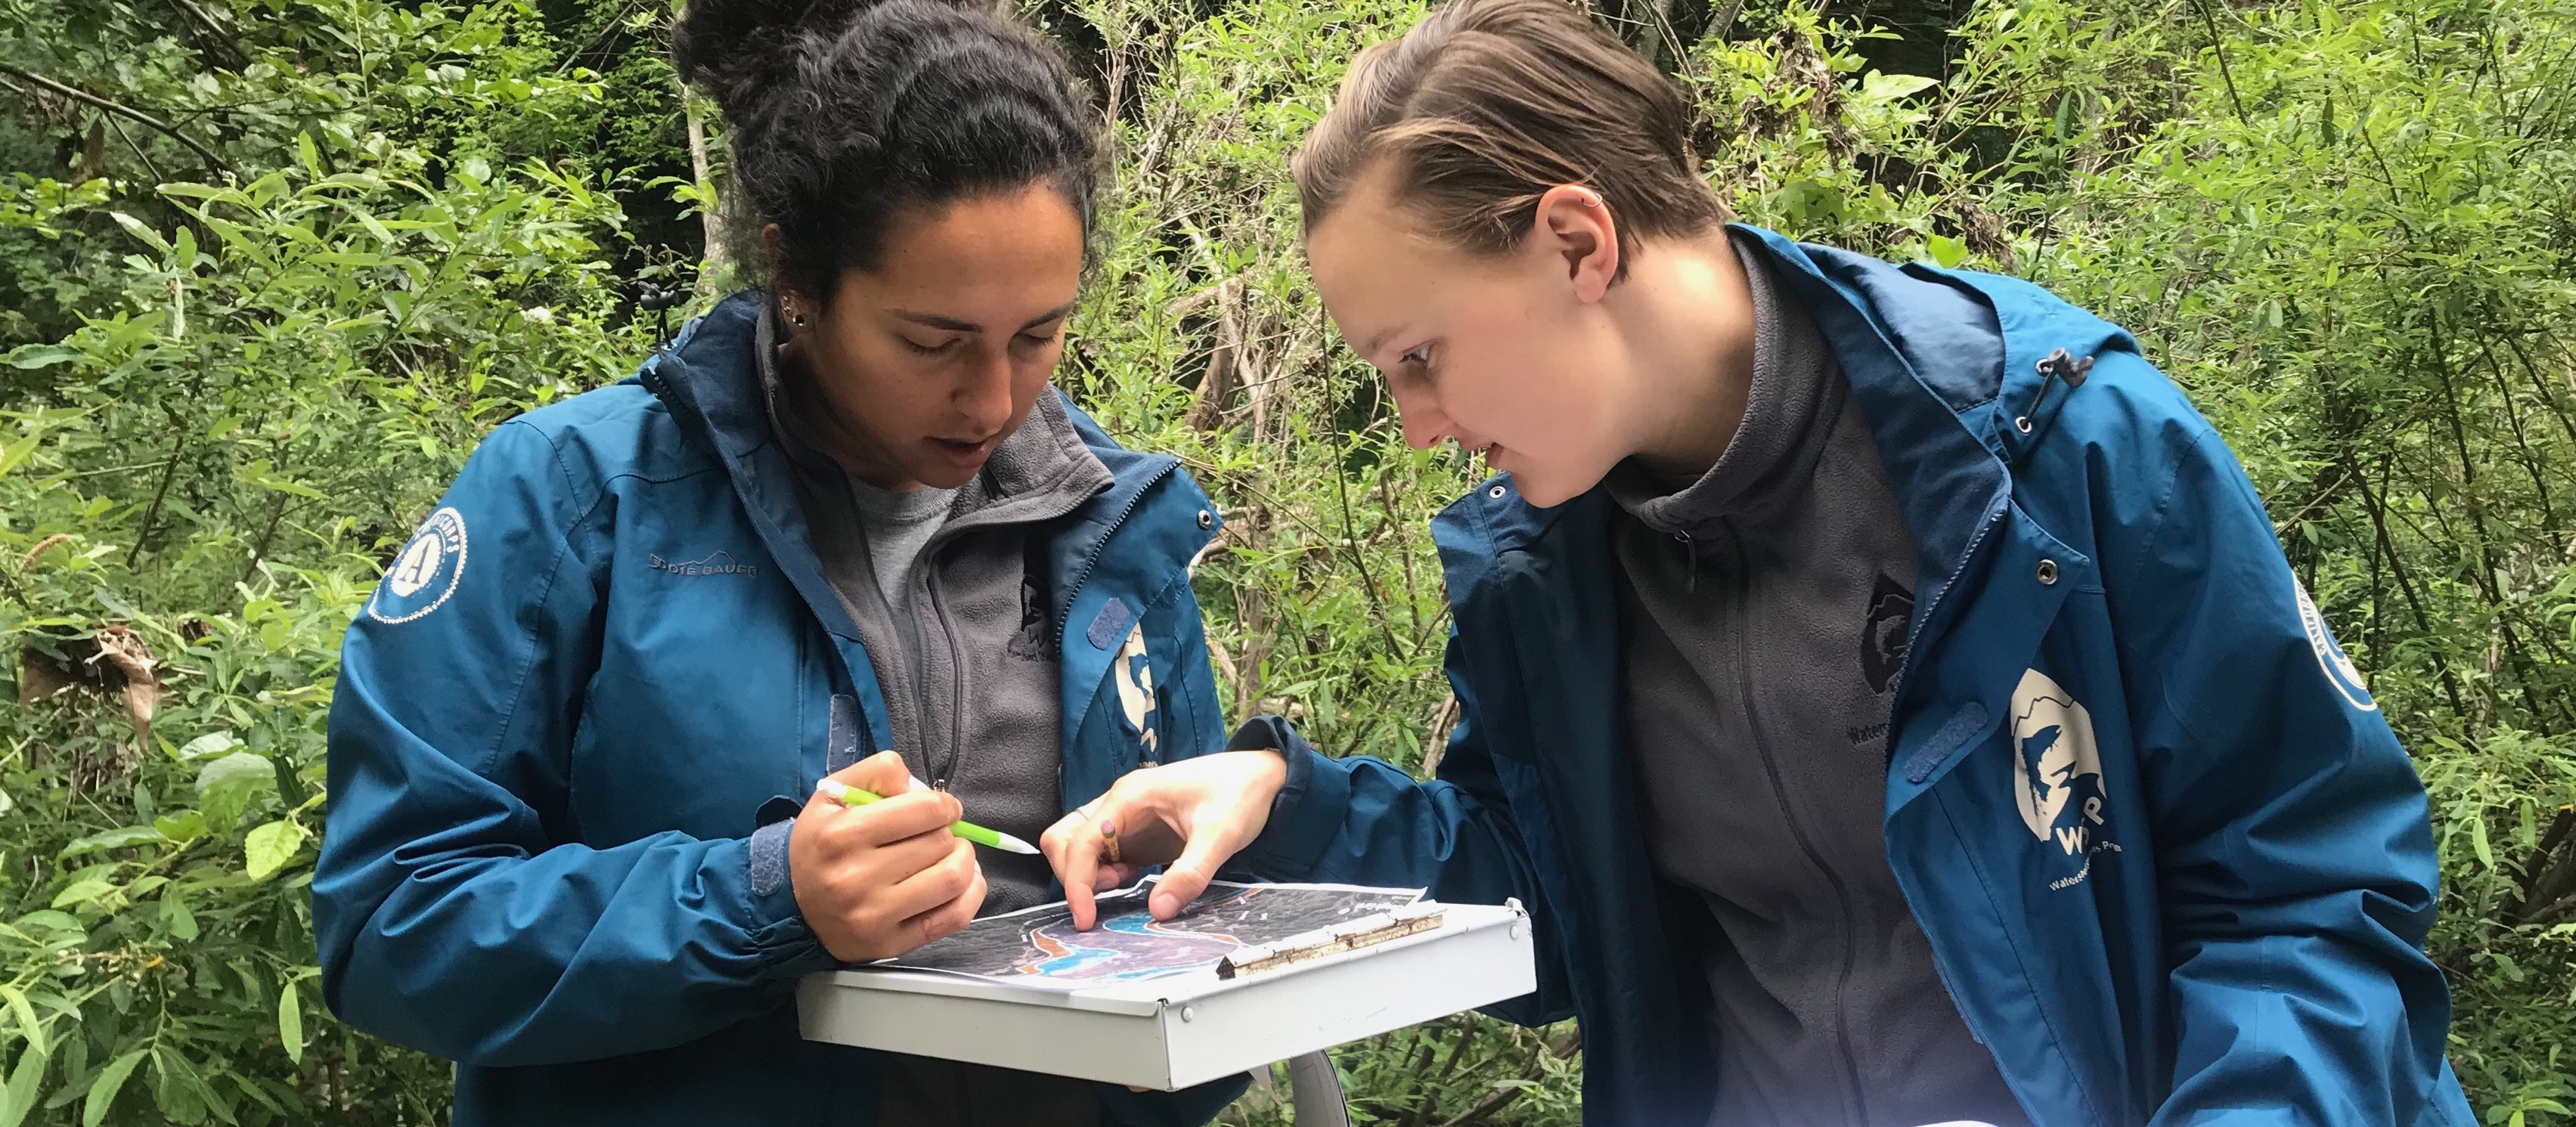
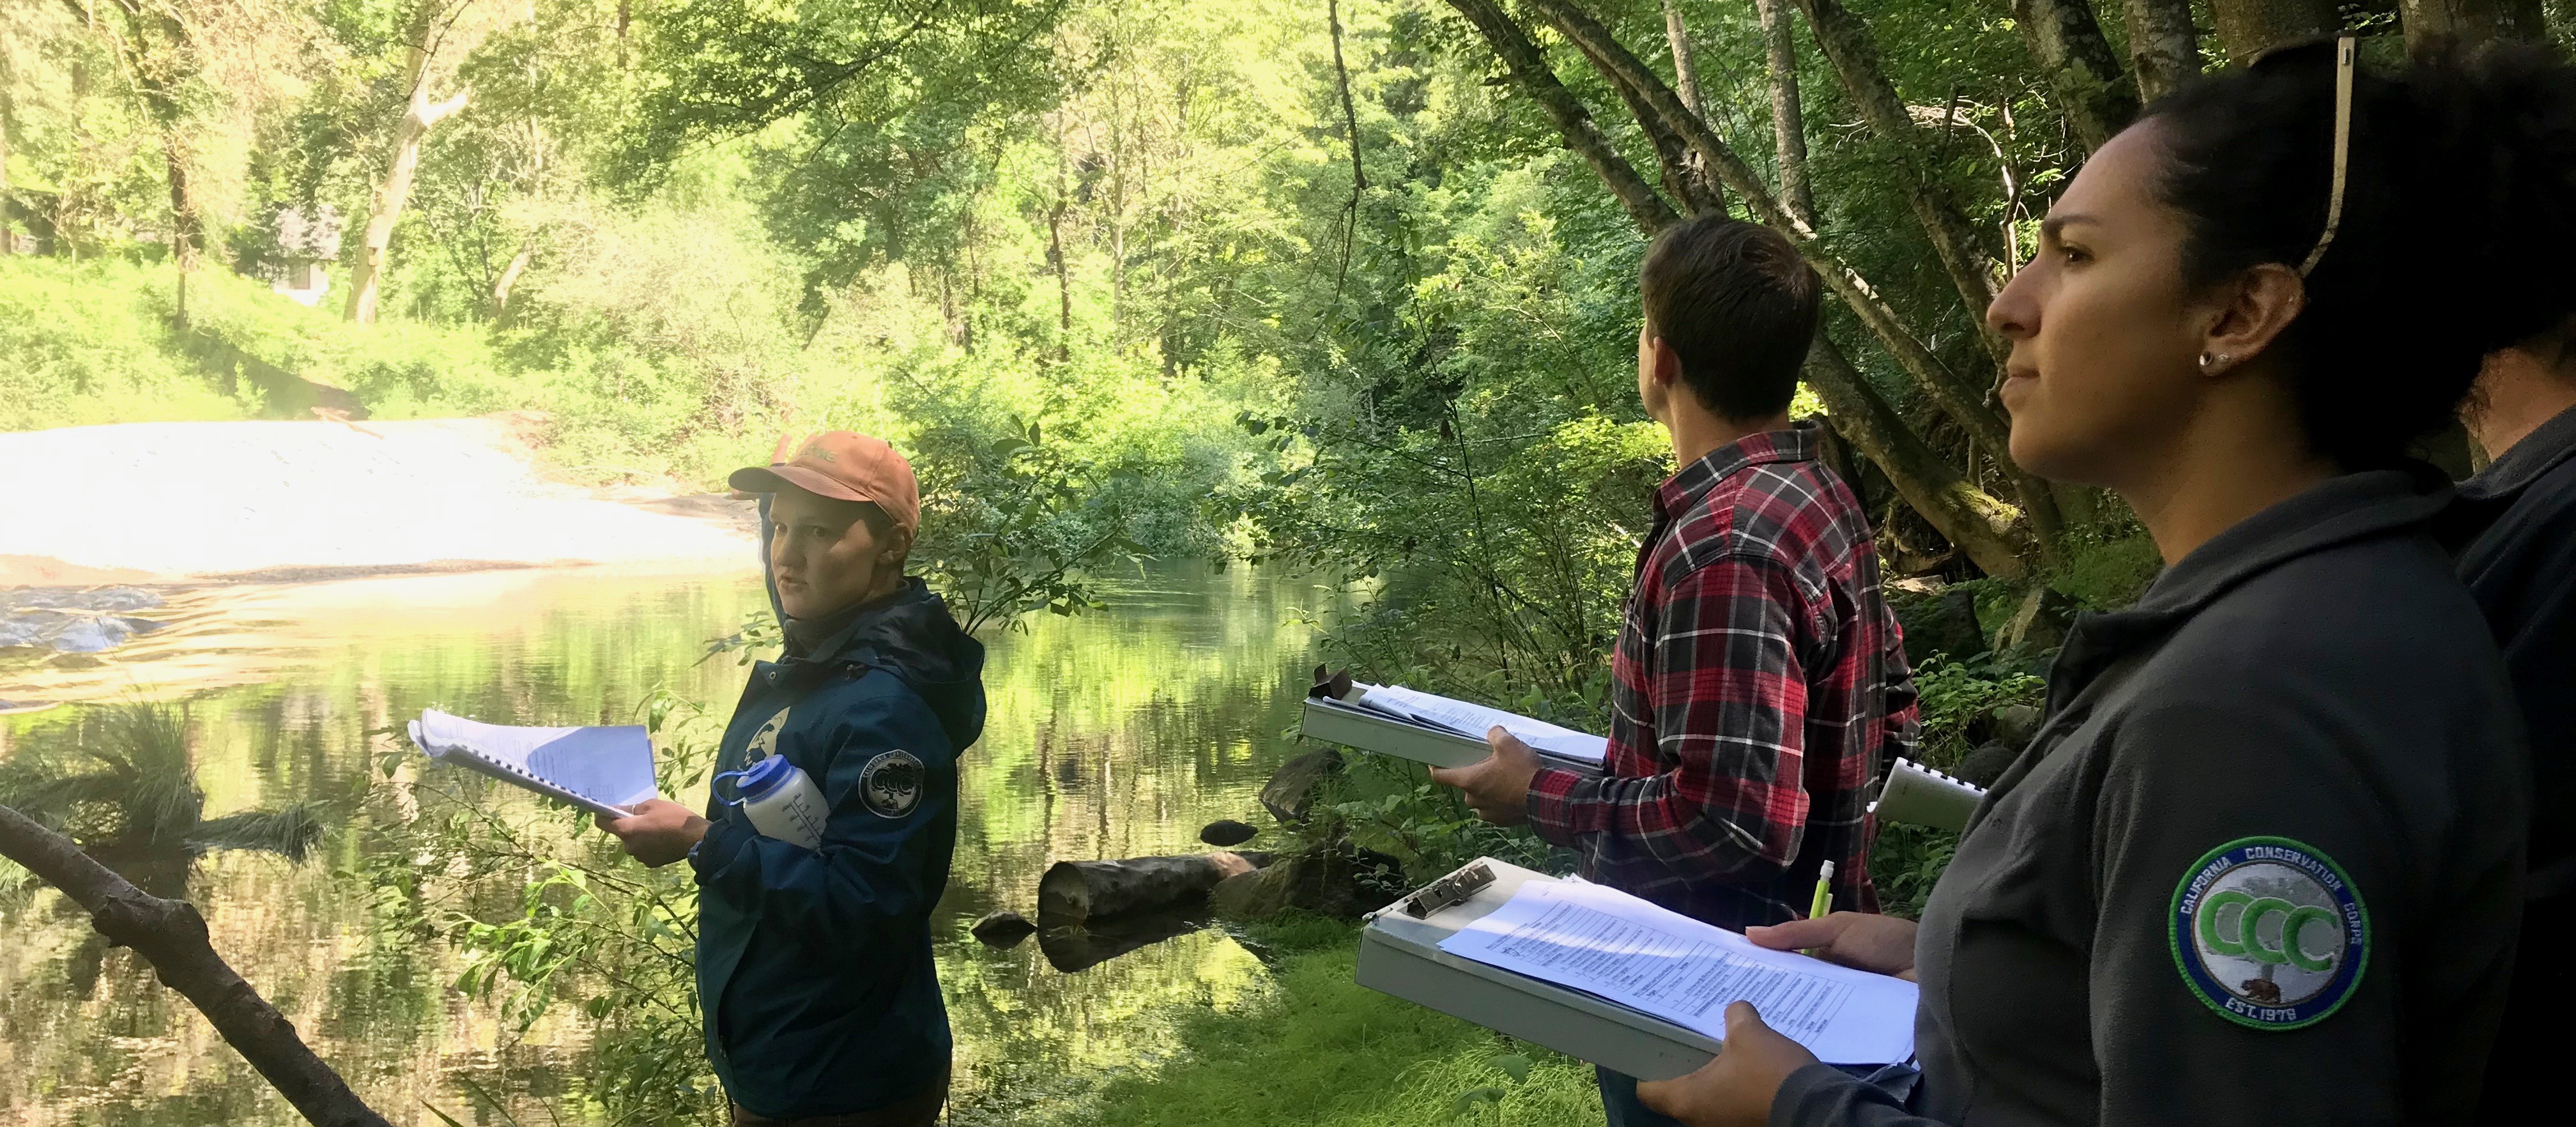
RipRAM enables two or more trained practitioners working together in the field to assess the overall health of a riparian area by choosing the best-fit set of narrative descriptions of observable conditions ranging from the worst commonly observed to the best achievable for a particular area being assessed. RipRAM yields an overall score for each assessed area based on the component scores of the eight metrics. The eight metrics are listed in the table below with brief descriptions:
| RipRAM Metric name | Description |
| Metric 1:
Total Riparian Cover |
Total perennial vegetation cover in riparian and channel areas, excluding the low-flow channel. Modifiers for connectivity to the adjacent uplands. |
| Metric 2:
Vegetation Cover Structure |
Tree cover in riparian and channel areas, excluding the low-flow channel. Modifiers for shrubs and helophytes (rushes, sedges, etc.). |
| Metric 3:
Vegetation Cover Quality |
Native tree and shrub species, with adjustments for different channel forms. Modifiers for man-made structures, non-native plants, and trash. |
| Metric 4:
Age Diversity and Natural Regeneration |
Prevalence and distribution of age classes of woody species (sprouts, saplings, adults, dead standing trees, and dead fallen trees) |
| Metric 5:
Riparian Vegetation Width |
Width of riparian vegetation relative to bankfull width, with adjustments for confined or non-confined valleys. |
| Metric 6:
Riparian Soil Condition and Permeability |
Soil cover by vegetative litter or herbaceous plants, with score reductions for bare zones, compaction, or impervious surfaces. |
| Metric 7:
Macroinvertebrate Habitat Patch Richness |
Physical structures that promote habitat: cobble/boulder, coarse gravel, sands and fines, leaf packs, fine woody debris, large woody debris, overhanging vegetation, and aquatic vegetation. Modifiers for large amounts of sands and fines, helophyte cover, and algae mats. |
| Metric 8:
Anthropogenic Alterations to Channel Morphology |
Hydromodification causing incision or aggradation, with modifiers for hardened structures, severe erosion, and disconnection from the floodplain. Streambank hardening and straightening. |