Deep-Sea Minerals

Minerals are found in various shapes and sizes in the deep marine environment. Some minerals form naturally in the ocean through chemical processes, whereas others are transported to the sea from terrestrial environments by wind or water flow. We are going to take a look at a few minerals found at various coring sites in the New Guinea region. With the help of the EDX and knowledge of chemical and physical properties of minerals, at minimum it is possible to determine a minerals group.


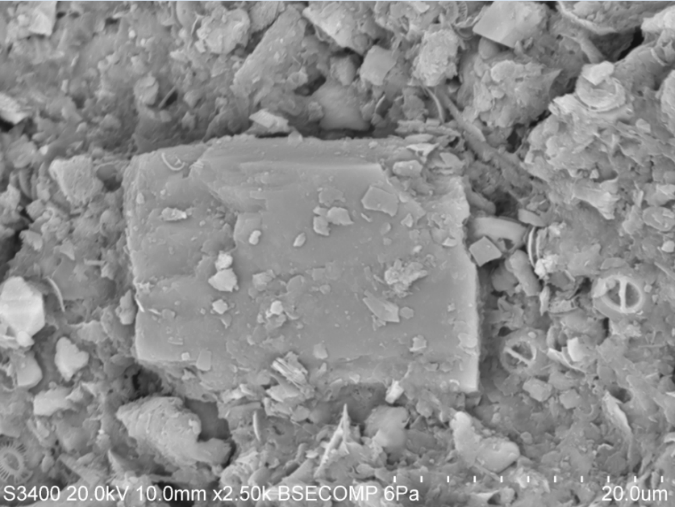
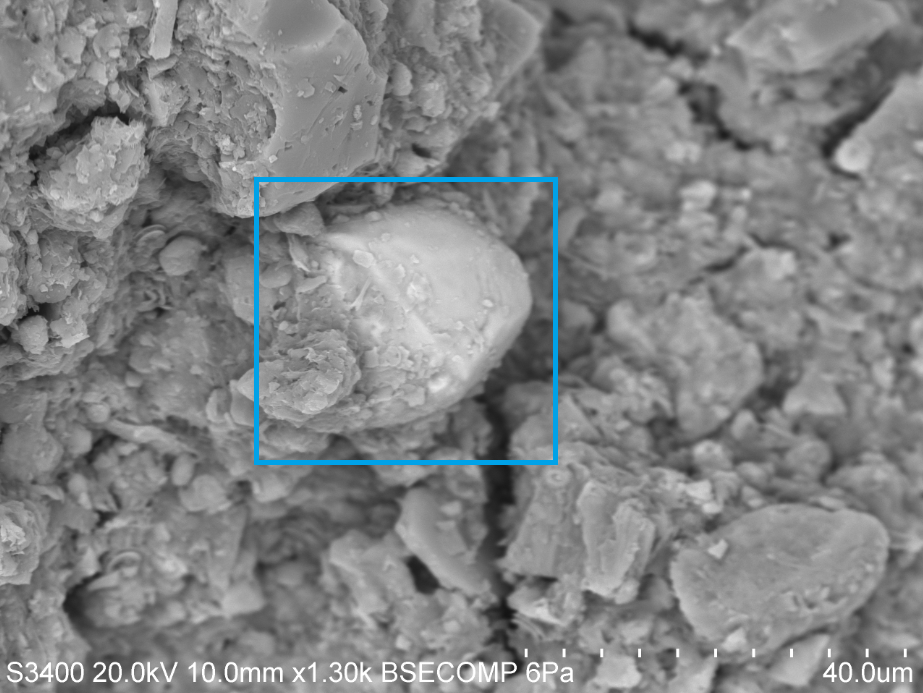
At first glance mineral identification on a SEM seems like an impossible task. However, we can deduce that this mineral likely belongs to the amphibole group. This is largely due to its orthorhombic shape and 120° cleavage plane. In mineralogy, cleavage is used to describe how a crystal breaks on a particular plane. EDX point scan analysis indicates that the mineral contains approximately 3% Al, 7% Fe, 8% Mg, 9% Ca, 24% Si, and 41% O. Since the chemical composition of an amphibole is NaCa2(Mg,Fe,Al)5(Al,Si)8O22(OH)2, we can be certain that this mineral is an amphibole.

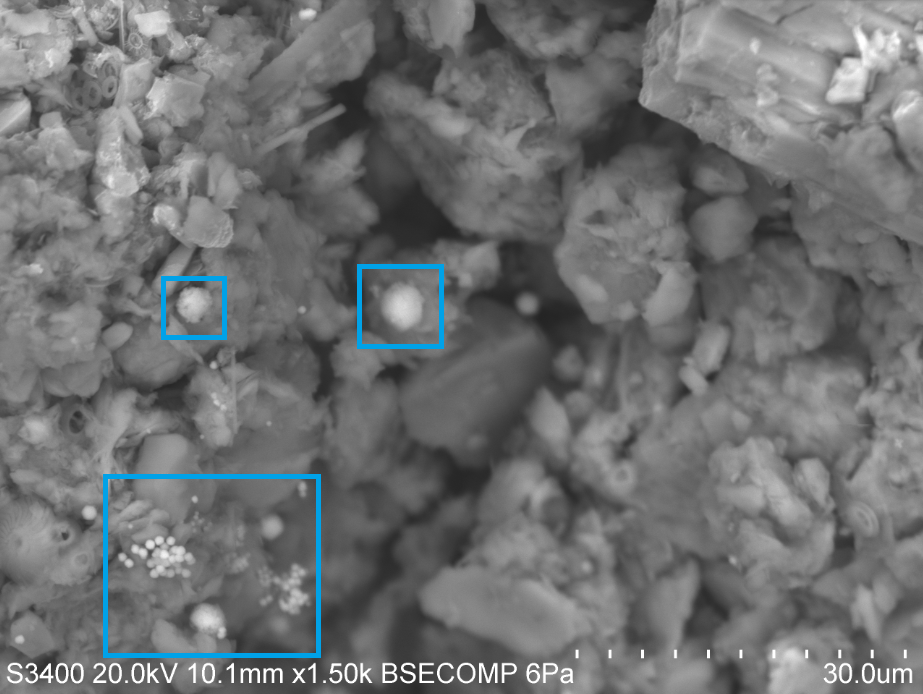
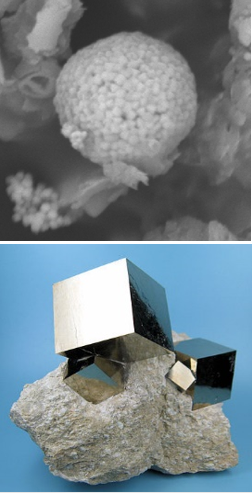
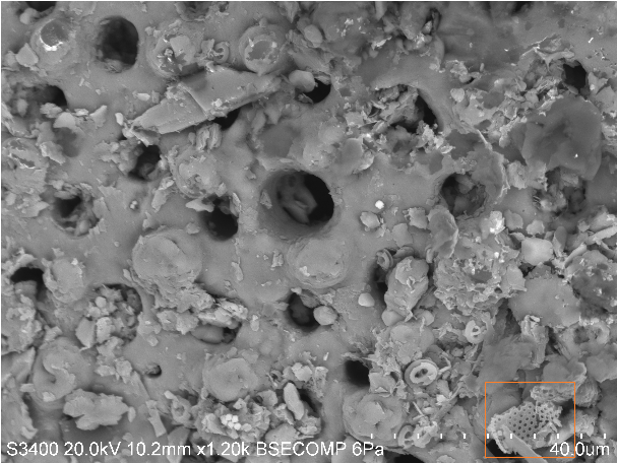
Is that really gold settling on top of marine sediment? Unfortunately, marine sediments are not a lucrative source of gold. What we are looking at here is pyrite (blue), known as fool’s gold. Pyrite has a chemical composition of FeS2 and its formation is largely dependent on sulfate availability in the ocean, where sulfate is converted by bacteria to hydrogen sulfide. Pyrite commonly forms perfect cubes, however in this case they are visualized as spherical aggregates of microcrystals, called framboids.


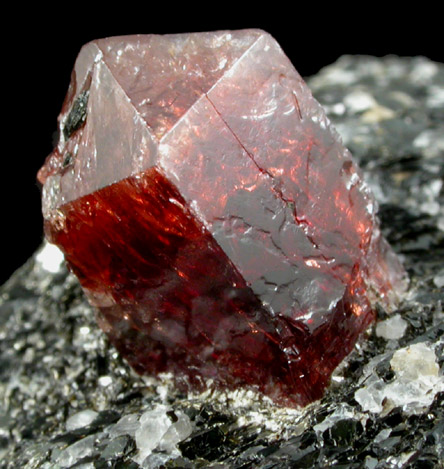
Heavy element minerals are indicators of mature, stable sediments. Since heavy minerals are often found concentrated in or around bedrock material, it is likely that this material is terrigenous. EDX microanalysis shows that this mineral contains approximately 17% Si, 50% Zr, and most of the remainder in oxygen. Based on the analysis, it can be inferred that this mineral displaying conchoidal fracture is a zircon (ZrSiO4) crystal.

Piston Core 23

Since we have covered fundamental information regarding microfossil composition and structure, now we can focus on individual core sites and general geology of the New Guinea region. The science crew aboard the Roger Revelle (RR1313) collected a total of 54 cores near the Papua New Guinea margin. Sites PC23 and GC22 are the southeastern most sites, situated east of the Sepik Delta and west of the Manam Volcano. We will be focusing on piston core site 23 (PC23) collected at a water depth of 712 m and a subsurface depth of 431-432 cm.

Tectonically, the New Guinea region is complex due the formation of a subduction zone by rapid (geologically speaking) motion of the sea-floor. Subduction, indicated on the map as black lines with the teeth, is a geological process that occurs when two plate boundaries collide. As the two plates collide the denser slab sinks into the mantle and beneath the lighter slab, where temperature and pressure progressively increase with depth. Under these conditions trapped fluids such as seawater generates magma, which rises into the upper slab, and forms a volcano. In this case, the Indo-Australian Plate is moving northeastward but crashes into the Pacific Plate that is moving west with a slight north component. This vertical and horizontal displacement is geometrically classified as oblique-slip faulting, resulting in the formation of a volcanic chain.


Sediment at PC23 is particularly exciting because it is biologically and lithologically diverse. The image on the right displays several coccolithophores on top of flaky clay-sized particles. The image on the left features several coccolithophores that have situated on top of a “hole bearing” organism, known as foraminifera. A smaller foram fragment (orange) is visible in the lower right. Looking at sediments on a SEM is especially useful for end-member microanalysis. Mineral end-member identification is used to distinguish between biogenic, terrigenous, and hydrothermal sediments, all of  which may be altered when water masses mix and interact with rock.


An EDX detector paired with the SEM is able to generate data in the form of a spectra that displays known elements in the point scan by focusing a high-energy beam of particles into the sample. The output spectroscopy peaks for Spectrum 2 above indicates that calcium is present (peak intensity does not correspond with weight %), verifying that the microfossil analyzed is a coccolithophore.


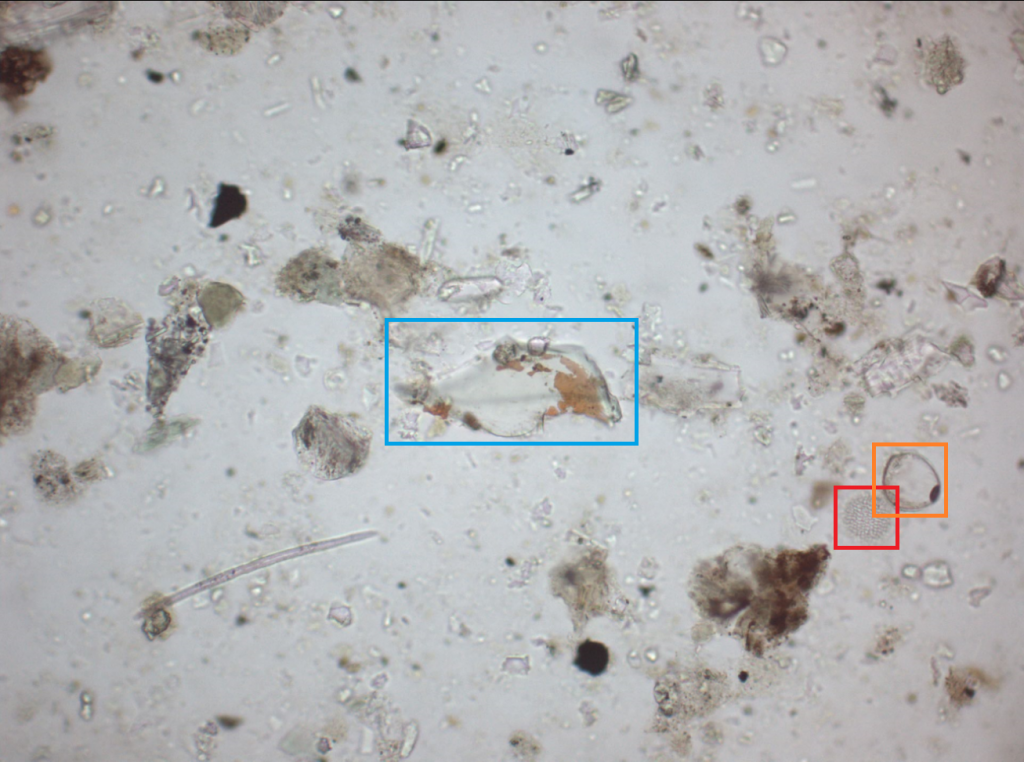
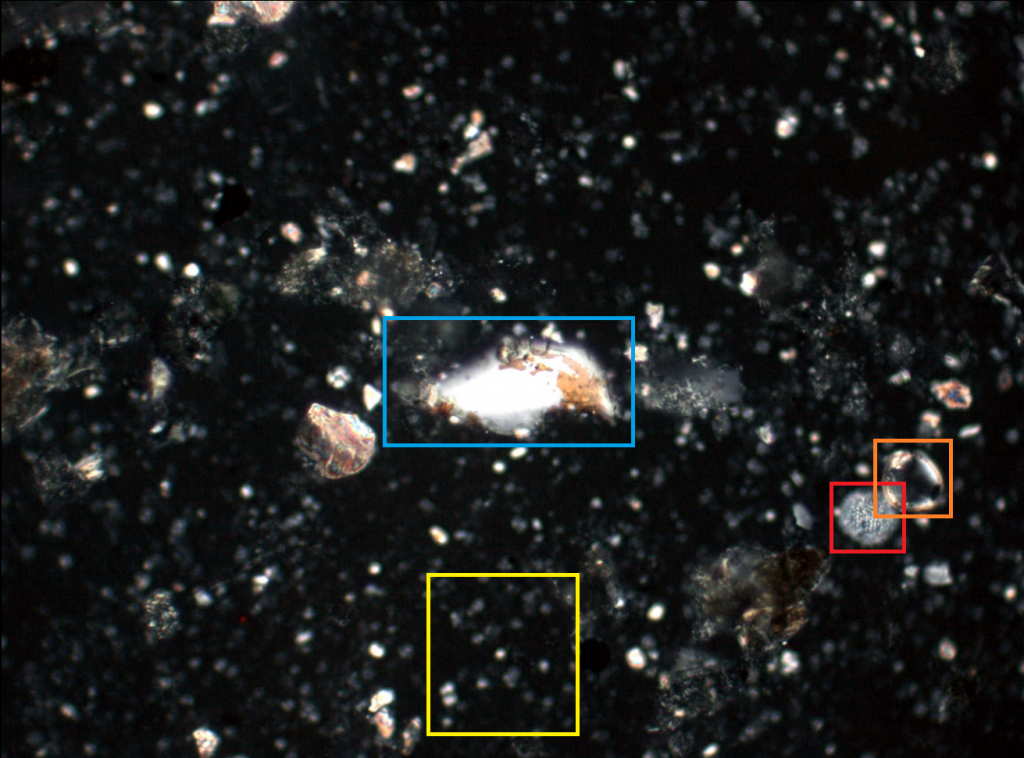
In addition, scientists can analyze sediments underneath a petrographic microscope by preparing smear slides. A smear slide is a thin layer of unconsolidated sediment spread onto a glass slide. Petrographic analysis of a smear slide gives quantitative and limited compositional information with the ability to view the sample in plane-polarized light (PPL, top) and cross-polarized light (XPL, bottom). Under PPL, the sediment from PC23 appears to be clay-rich and contain minimal biogenics. However, under XPL we can see that the sediment is abundant in biogenics relative to the other particles. Coccolithophores (cluster in yellow) are calcite bearing organisms that are only visible in XPL. The dinoflagellate (red) and foraminifera (orange) are visible under both light conditions. The centered shard of vitric material (blue) is an indicator of hydrothermal activity and suggests volcanism. The combined use of a SEM and petrographic microscope make for strong tools to reconstruct ancient oceans.


Of quartz, that’s quartz!

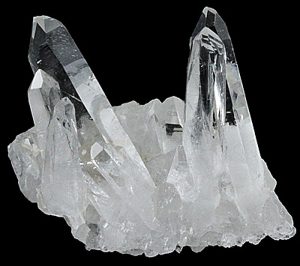
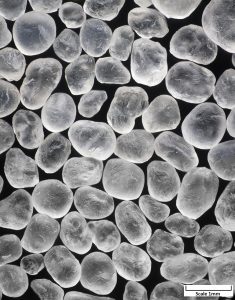
Quartz is one of the most common minerals within beach sand, and often serves as an indicator of weathering and erosion depending upon abundance and surface textures. The general public likely associates quartz with large transparent crystals (figure 1, left). Geologists often think of quartz as a common mineral within dikes, or a body of rocks/minerals that form in the pre-existing fractures of rock (figure 1, middle). On the other hand, sedimentologists are prone to thinking of quartz as semi-transparent and weather-resistant grains (figure 1, right).

Figure 1: (Left) Quartz crystals. (Middle) Dike comprised of a quartz vein. (Right) Quartz grains.

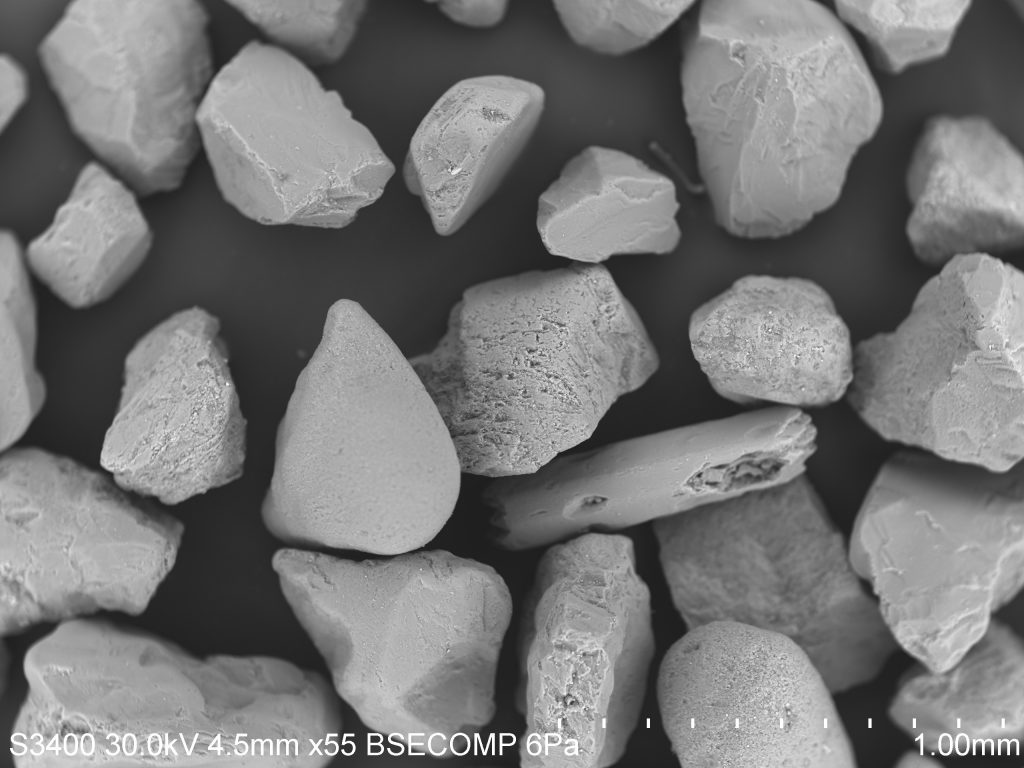
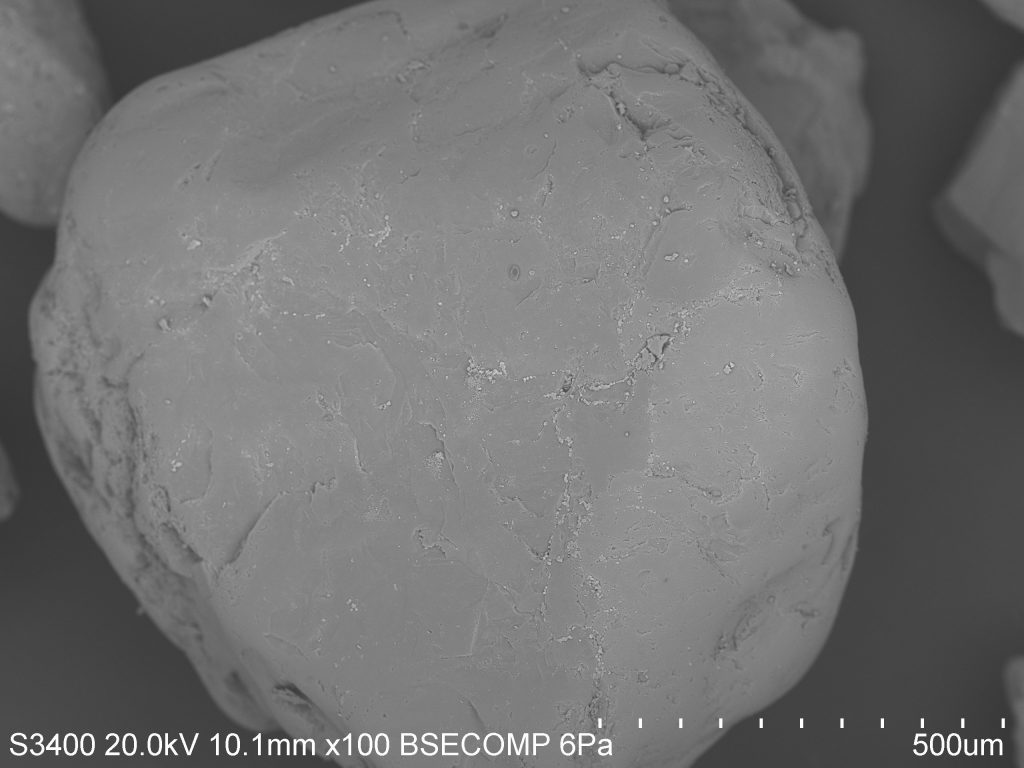
Quartz grains within sand must be identified before assessing weathering and erosional parameters. Figure 2 shows an SEM image of a sand sample from Moss Landing Beach at 55x magnification. To the untrained eye, distinguishing a quartz grain from feldspar, mica, magnetite, or other minerals may seem daunting. Many clues used to identify minerals, such as color, luster, streak, and hardness, cannot be employed here. But after a bit of searching, the grain in figure 3 appears promising due to a lack of both cleavage planes and large pits.

Figure 2: SEM image of a sand sample from Moss Landing Beach (magnification: 55x).

Figure 3: SEM image of a quartz grain from a sand sample taken at Moss Landing Beach (magnification: 100x).

Determining the elemental composition may help to confirm that the grain in figure 3 is quartz. Luckily, the SEM has an energy-dispersive x-ray spectrometer (EDX) that characterizes elemental composition. After only a few minutes of calibration and analysis the EDX provides results, suggesting that a point in the middle of the grain is 33.33% silicon and 66.67% oxygen. This supports the hypothesis that it is a quartz grain, given that the composition of quartz is SiO2.

Sponges and Spicules

We've dabbled a bit with invertebrates thus far, talking about house flies and various planktonic organisms, but now we're going to work our way into some more "visible" representatives, even if they often get overlooked. That group, the phylum Porifera, represents the 8,755 valid species of sponge, most all of which are marine. While some sponges are very colorful (such as the Caribbean Blue Sponge) or very large (Giant Barrel Sponge), most sponges are small or cryptic and require very fine-scale analysis for proper species identification. Seems like a perfect application for SEM technology! Continue reading below for an introduction to spicules (the "bricks" of sponge architecture) and how they can be used to identify individual species.

Some terminology, to begin, because sponge taxonomy is a whole other language in itself even by science standards. The exoskeleton of sponges (so, the parts that you see) are composed of a mixture of  spongin and/or spicules. Spongin is a modified type of collagen protein, and forms the "fibers" or "mortar" that hold spicules together.  Generally, species are identified based on the presence or absence of spongin in a sample. Spicules are the structural components of a sponge, or the "bricks," and the shapes, sizes, and composition are unique for each species. Together, you can look at these features under a microscope to make a positive identification.


Spicules are composed of either Calcium or Silica. Looking at composition is another way to narrow down possible sponge groupings. The "brightness" of the sample under the SEM is one way to guess at content. Calcium has a higher atomic number than Silica and is a better conductor, so it appears brighter. However, we recently learned how to use the Energy-Dispersive X-ray (EDX) function of our SEM. EDX detects and measures X-rays generated by a sample, the specifics of which are determined by elemental composition. With this tool, we were able to determine the elemental makeup of several geographically diverse samples.

Left: a siliceous deep-sea sponge whose spicules form discrete hexagonal patterns, the bottom of which you can see. Right: a calcareous semi-tropical sponge with a loosely-formed spicule matrix.

This is a very basic description of sponge identification, but there are loads of resources available on the internet, and spicules themselves can be quite beautiful. For more information, please feel free to visit:

  1. Shape of Life for short videos about sponges and their spicules
  2. The World Porifera Database for recent publications, photos, and information
  3. Southern California Association of Marine Invertebrate Taxonomists for the aforemetioned "dictionary" of spicule morphological terms

The Workings of a Scanning Electron Microscope

Now that you have been exposed to what types of images a Scanning Electron Microscope or SEM, can produce, it might be time to understand a little bit about what the SEM is and how it works.

A SEM is essentially an extremely well magnified with high resolution microscope. At some point in all our lives we have been exposed to microscopy. It doesn’t matter whether it was to manipulate sunlight on a hot day to burn a bug or in a high school biology class. The point is, microscopy essentially takes something you are interested in and lets you look at it from a new newer but smaller perspective.


In the science world, there are a variety of different microscopes that use a handful of mechanisms. The compound microscope and the dissection microscope are two of the most common. These microscopes use visible light to look at the specimen. Although the resolution is not great, the magnification allows a scientist to see down to the cell level. The confocal microscope uses a laser light that scans across the specimen. The image that is created from the scan is then transferred to a computer where the scientist can do further analysis. The SEM and the Transmission Electron Microscope or TEM both use electrons, or negatively charged particles, to create an image. When using the SEM, the pedestal with the sample is coated with conductive material such as gold or graphite. The electrons from the beam of the SEM bounce off the sample creating backscatter electrons that are used to make an image in 3D. The TEM allows for some electrons to pass through the sample so that the scientist can look at different layers within the sample. Both the SEM and the TEM have very high magnification and resolution, as I am sure you have seen in some of our previous posts. This technology along with add on tools such as the Energy Dispersive X-Ray Analysis tool, or EDX, allows scientists to look at specimens at the atomic level, making species identification and elemental composition of a specimen precise.


The best part of the SEM is getting to see relatively anything at its structural level. We can experiment with just about anything and explore its inner workings within minutes. Even though our field of study lies with the ocean, our curiosity and excitement over the use of the SEM has encouraged us to explore all realms around us including the fly on the windowsill. Who knows what we will look at next!

Biogenic Ooze

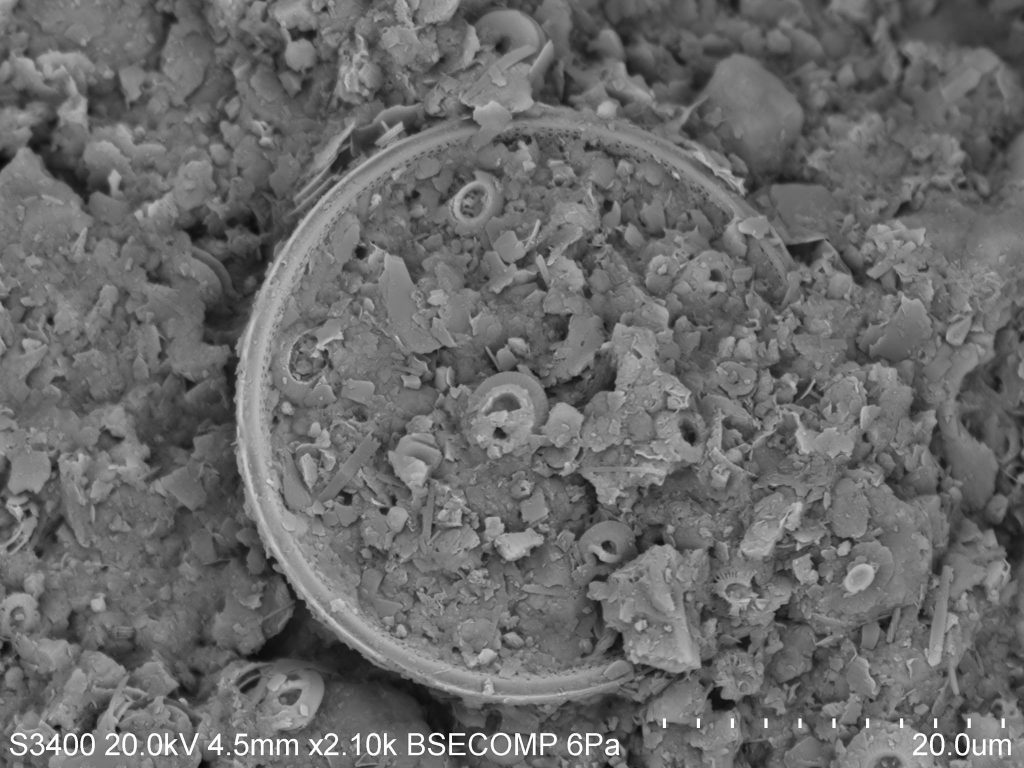
Biogenic sediments extracted from deep-sea sediment cores enable scientists to piece together a story about Earth’s early marine environments and past climate. This particular sample was collected off the coast of Papua New Guinea in the western Pacific Ocean by the International Ocean Discovery Program’s expedition RR1313. Microfossil-rich sediments, such as the one pictured above is termed a biogenic ooze and is characterized by containing greater than 30 percent skeletal debris.


The disk-shaped organism featured above is a well-preserved concentric diatom surrounded by a type of phytoplankton, known as a coccolithophore. In terms of shape and size, coccolithophores are a highly diverse group of phytoplankton that produce calcareous skeletons composed of calcium carbonate (CaCO3) called coccoliths. Whereas diatoms are encased by a hard-shelled silica (SiO2) body, often referred to as opal. The siliceous shells of diatoms allow them to endure turbulent mixing in the upper layers of the ocean. As diatoms bloom and die, they sink to the bottom of the ocean and become exceptionally useful in paleoceanographic research. Microfossils are used to infer rates of sedimentation, biological productivity, nutrient availability and oxygenation events which are imperative to understanding past, present, and future climate.


Foraminifera and Coccolithophores

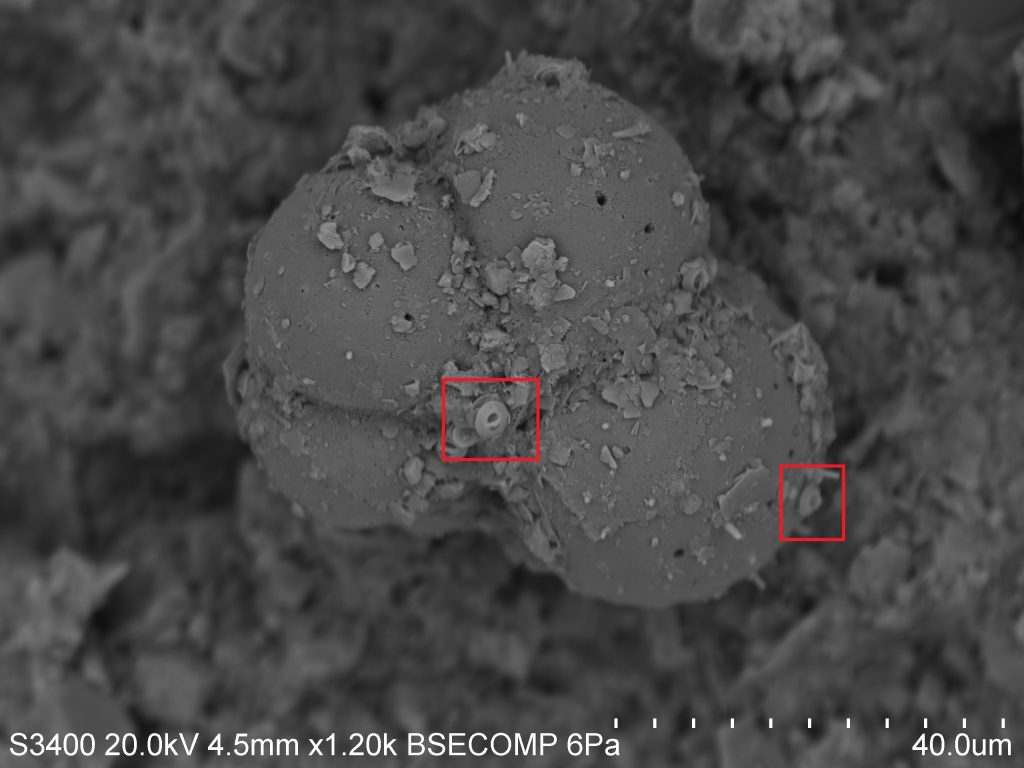
Chances are you'll be seeing a fair bit of discussion regarding plankton as we go forward, because (1) they show up in many of our samples, and (2) there's a lot we can learn by studying them! SEM is especially useful for the study of plankton, as their small size makes traditional compound microscopes somewhat ineffective. This photograph, taken during our first run-through with the SEM, shows an image at 1,200X magnification, as compared to the 100X magnification you might hope to get with a standard scope!


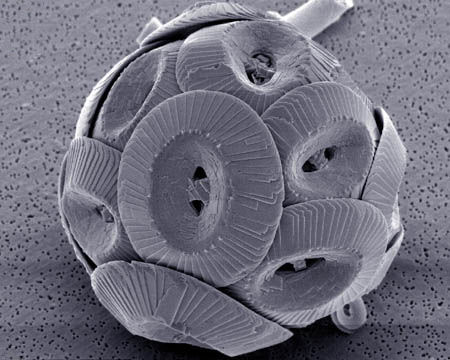
In the above photo we can see examples of both zooplankton (microscopic animals) and phytoplankton (microscopic plants). The first is the obvious, bulbous species in the middle of the image. This is the test, or shell, of a Foraminifera. Forams represent an ancient and speciose group of zooplankton which live mostly in sediment (as is the case here), but also in the water column. Within the red squares you will see a second, smaller phytoplankton species known as a Coccolithophore. The round plates are known individually as placoliths, and bundle together around the algal species to form a coccosphere. I've included the photo below to give you an idea of how they appear when alive in nature. Similarly, coccolithophores inhabit both benthic and open-water habitats.


Plankton species such as these can provide a surprising amount of information not only about themselves, but also about the environment in which they grow.  The tests you see here are made of calcium carbonate (CaCO3) which the organisms "pull" out of the water and use to build their hard parts. As such, isotopic analysis of these tests can tell you about the atmospheric and oceanic conditions at the time of their formation, since the two systems are linked in the carbon cycle. When the organism dies, calcium carbonate sinks to the bottom of the ocean in the form of coccoliths and other tests and become a part of the sediment record, which can be studied later by scientists as part of a sediment core.

There are many other applications in the study of plankton, some of which we will likely cover in future installations. Stay tuned, and remember: It's the little things.

Common Housefly

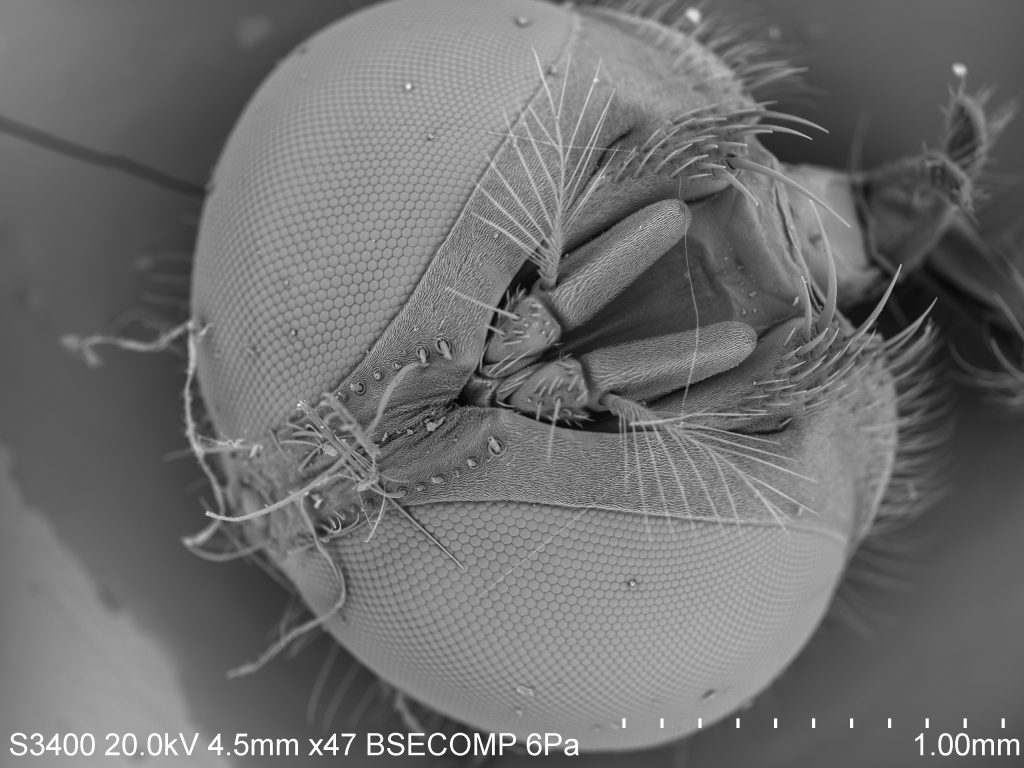
This SEM image of a housefly at 47x magnification highlights the intricacies possessed by even the most common lifeforms. One may be intrigued by the stark contrast between the fine hairs and the thousands of hexagonal structures making up the eyes. Together the eyes create a mosaic-like image, giving flies spectacular peripheral vision. This may seem like a huge visual advantage. However, flies are unable to focus; they can see motion and form, but are unable to clearly see objects. This is why flies are so quick to flee. They see something headed their way, but have no clue what it may be.


The hexagonal shape making up a fly’s vision is not unique in the natural environment. This structure is found in numerous natural features such as honeycombs, columnar basalt, turtle shells, snakeskin, etc. This structure is so commonly found due to its geometry. Triangles, squares, and hexagons are the only three shapes with equal sides and angles that fill a flat plane. Of these, hexagons require the least total length of wall, making it the more efficient shape.


Marine Bacteria on Top of a Diatom Chain

Bacteria = rod shaped cells approximately 1-2µm (smaller than blood cells).

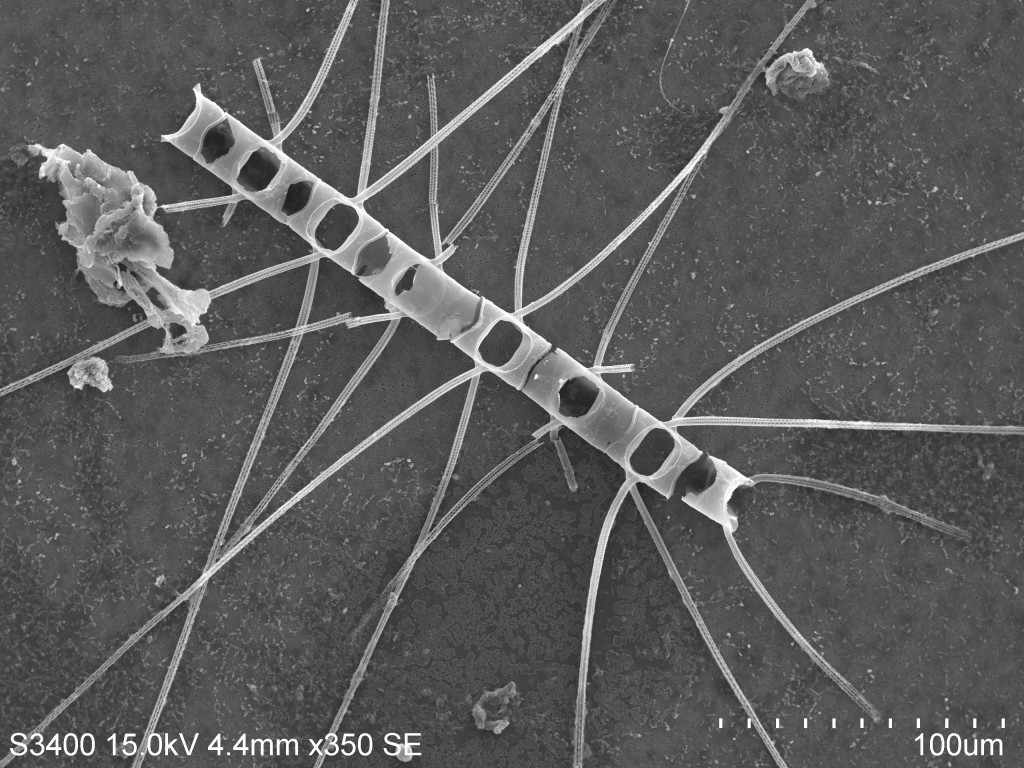
Bacteria sit atop a diatom chain (Chaetoceros unknown sp.) absorbing dissolved organic carbon, enjoying the 28C surface water temperature, and undergo binary fission whenever they want. Unbeknownst to them, the bacteria are scooped up in the middle of the Atlantic by Jules Kuo and Jasmine Ruvalcaba (recent graduates of MLML) using a zooplankton net that captures organisms >50 µm.  The bacteria are around ~1-2 µm but they were able to be captured as they have glommed onto this chain forming diatom.  Though the individual diatoms themselves are 10 µm in diameter, they can form chains containing more than 12 individuals at a time (~120 µm).