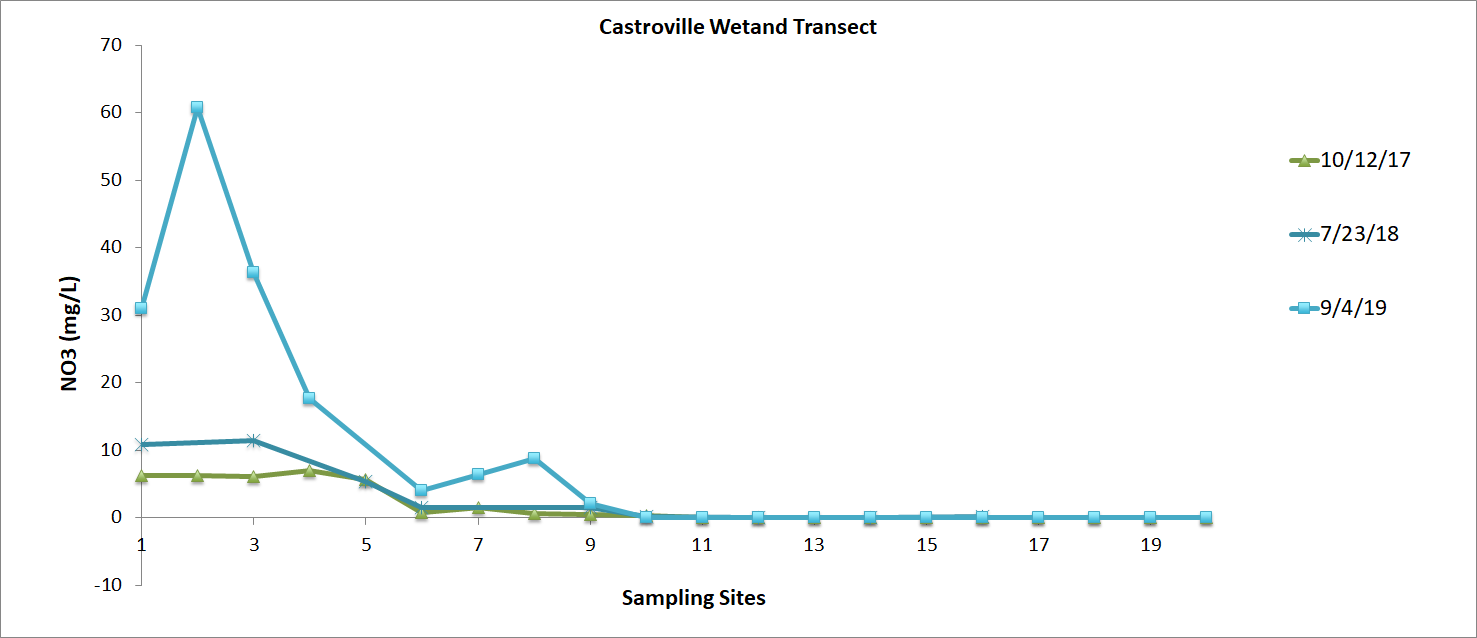
Castroville Slough Treatment Wetland
This scatter plot of treatment wetland data shows how this type of treatment system can work under exposure to different nitrate concentrations. When the wetland was first established in 2017, and again in 2018, low concentrations of nitrate (between 5 and 12 mg/L) were reduced to nearly 0 mg/L over the distance of the wetland channel. In 2019, the wetland was artificially spiked by CCWG staff, showing that even when exposed to very high concentrations of nitrate, the wetland can still work to reduce nitrate levels across its full distance.
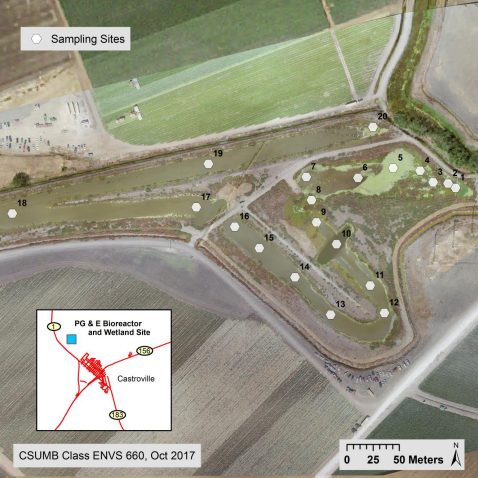
The second image shows the locations of sampling sites in the treatment wetland transect. Water from the 12-chamber bioreactor flows out into the wetland from the right side of the picture and through each site in numerical order (from site 1 to site 20).
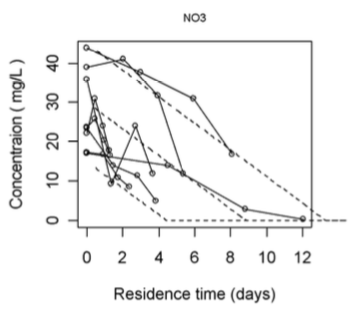
Molera Road Treatment Wetland
After implementation and monitoring of the Molera Wetland, nitrogen concentration rates were found to be reduced by 5 to 20 mg/L depending on residence times. This is a result of water denitrifying as it passes through the constructed wetland. The graph below shows the change in Nitrogen concentration (mg/L) through the Molera wetland over various residence times.